Sales Kpi

Infrastructure KPI Dashboard Showing Cost Reduction And Procurement Mockup PDF
Deliver an awe inspiring pitch with this creative infrastructure kpi dashboard showing cost reduction and procurement mockup pdf bundle. Topics like cost reduction, procurement roi, avoidance, savings can be discussed with this completely editable template. It is available for immediate download depending on the needs and requirements of the user.
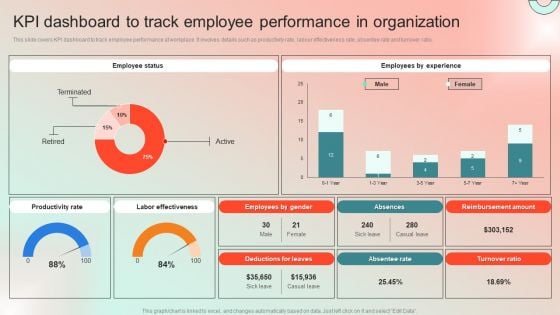
KPI Dashboard To Track Employee Performance In Organization Demonstration PDF
This slide covers KPI dashboard to track employee performance at workplace. It involves details such as productivity rate, labour effectiveness rate, absentee rate and turnover ratio. Take your projects to the next level with our ultimate collection of KPI Dashboard To Track Employee Performance In Organization Demonstration PDF. Slidegeeks has designed a range of layouts that are perfect for representing task or activity duration, keeping track of all your deadlines at a glance. Tailor these designs to your exact needs and give them a truly corporate look with your own brand colors they will make your projects stand out from the rest.
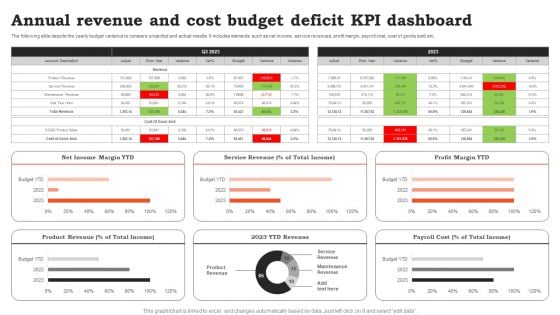
Annual Revenue And Cost Budget Deficit KPI Dashboard Ideas PDF
The following slide depicts the yearly budget variance to compare projected and actual results. It includes elements such as net income, service revenues, profit margin, payroll cost, cost of goods sold etc. Showcasing this set of slides titled Annual Revenue And Cost Budget Deficit KPI Dashboard Ideas PDF. The topics addressed in these templates are Cost Budget, Deficit KPI Dashboard. All the content presented in this PPT design is completely editable. Download it and make adjustments in color, background, font etc. as per your unique business setting.
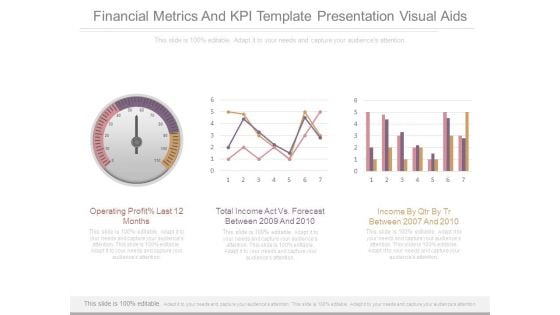
Financial Metrics And Kpi Template Presentation Visual Aids
This is a financial metrics and kpi template presentation visual aids. This is a three stage process. The stages in this process are operating profit last 12 months, total income act vs forecast between 2009 and 2010, income by qtr by tr between 2007 and 2010.
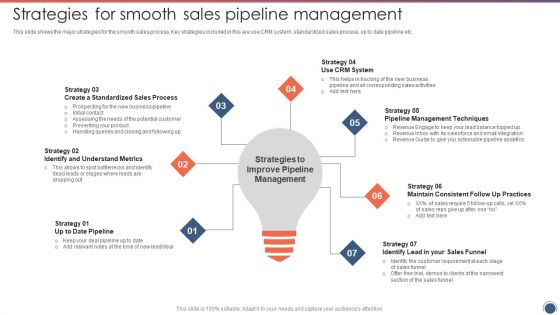
Strategies For Smooth Sales Pipeline Management Sales Funnel Management Strategies To Increase Sales Inspiration PDF
This slide shows the major strategies for the smooth sales process, Key strategies included in this are use CRM system, standardized sales process, up to date pipeline etc.Presenting Strategies For Smooth Sales Pipeline Management Sales Funnel Management Strategies To Increase Sales Inspiration PDF to provide visual cues and insights. Share and navigate important information on seven stages that need your due attention. This template can be used to pitch topics like Management Techniques, Maintain Consistent, Understand Metrics. In addtion, this PPT design contains high resolution images, graphics, etc, that are easily editable and available for immediate download.

Financial KPI Dashboard With Profit And Loss Analysis Designs PDF
Showcasing this set of slides titled Financial KPI Dashboard With Profit And Loss Analysis Designs PDF. The topics addressed in these templates are Assets And Liabilities, Cash Flow Analysis, Income And Expenses. All the content presented in this PPT design is completely editable. Download it and make adjustments in color, background, font etc. as per your unique business setting.
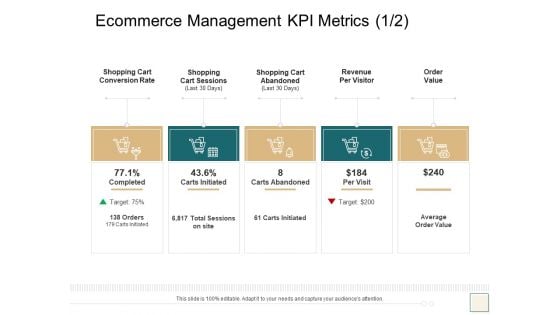
B2B Trade Management Ecommerce Management KPI Metrics Order Elements PDF
Presenting b2b trade management ecommerce management kpi metrics order elements pdf to provide visual cues and insights. Share and navigate important information on five stages that need your due attention. This template can be used to pitch topics like shopping cart conversion rate, shopping cart sessions, shopping cart abandoned, revenue per visitor, order value. In addtion, this PPT design contains high-resolution images, graphics, etc, that are easily editable and available for immediate download.
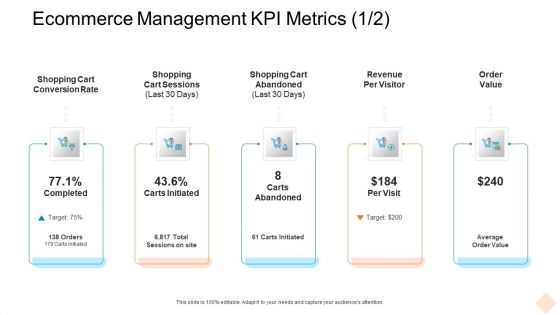
Ecommerce Management KPI Metrics Days Ppt Slides Templates PDF
This is a ecommerce management kpi metrics days ppt slides templates pdf template with various stages. Focus and dispense information on five stages using this creative set, that comes with editable features. It contains large content boxes to add your information on topics like revenue per visitor, average order value, target. You can also showcase facts, figures, and other relevant content using this PPT layout. Grab it now.
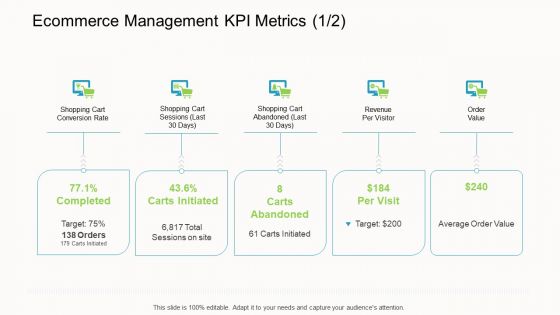
Online Corporate Approach Ecommerce Management KPI Metrics Last Sample PDF
This is a online corporate approach ecommerce management kpi metrics last sample pdf template with various stages. Focus and dispense information on five stages using this creative set, that comes with editable features. It contains large content boxes to add your information on topics like revenue, conversion rate, average order value. You can also showcase facts, figures, and other relevant content using this PPT layout. Grab it now.
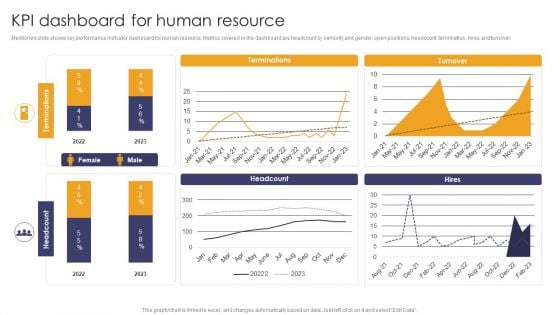
Implementing Succession Planning KPI Dashboard For Human Resource Template PDF
Mentioned slide shows key performance indicator dashboard for human resource. Metrics covered in the dashboard are headcount by seniority and gender, open positions, headcount, termination, hires and turnover. If you are looking for a format to display your unique thoughts, then the professionally designed Implementing Succession Planning KPI Dashboard For Human Resource Template PDF is the one for you. You can use it as a Google Slides template or a PowerPoint template. Incorporate impressive visuals, symbols, images, and other charts. Modify or reorganize the text boxes as you desire. Experiment with shade schemes and font pairings. Alter, share or cooperate with other people on your work. Download Implementing Succession Planning KPI Dashboard For Human Resource Template PDF and find out how to give a successful presentation. Present a perfect display to your team and make your presentation unforgettable.

Internal Employee Succession KPI Dashboard For Human Resource Information PDF
Mentioned slide shows key performance indicator dashboard for human resource. Metrics covered in the dashboard are headcount by seniority and gender, open positions, headcount, termination, hires and turnover. If you are looking for a format to display your unique thoughts, then the professionally designed Internal Employee Succession KPI Dashboard For Human Resource Information PDF is the one for you. You can use it as a Google Slides template or a PowerPoint template. Incorporate impressive visuals, symbols, images, and other charts. Modify or reorganize the text boxes as you desire. Experiment with shade schemes and font pairings. Alter, share or cooperate with other people on your work. Download Internal Employee Succession KPI Dashboard For Human Resource Information PDF and find out how to give a successful presentation. Present a perfect display to your team and make your presentation unforgettable.
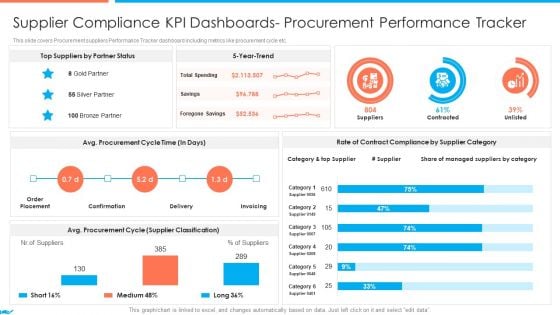
Supplier Association Management Techniques Supplier Compliance Kpi Dashboards Topics PDF
This slide covers procurement suppliers performance Tracker dashboard including metrics like procurement cycle etc. Deliver an awe inspiring pitch with this creative supplier association management techniques supplier compliance kpi dashboards topics pdf bundle. Topics like reduction in costs, increased efficiency, increase in profitability can be discussed with this completely editable template. It is available for immediate download depending on the needs and requirement of the user.
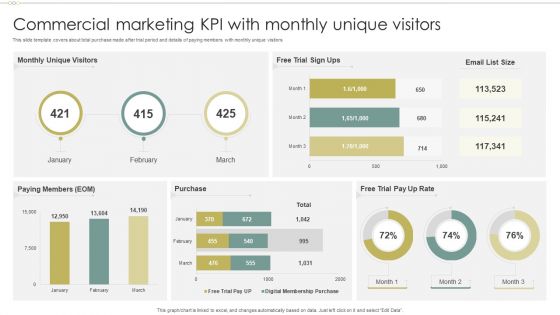
Commercial Marketing KPI With Monthly Unique Visitors Graphics PDF
This slide template covers about total purchase made after trial period and details of paying members with monthly unique visitors.Showcasing this set of slides titled Commercial Marketing KPI With Monthly Unique Visitors Graphics PDF. The topics addressed in these templates are Unique Visitors, Paying Members, Trial Pay. All the content presented in this PPT design is completely editable. Download it and make adjustments in color, background, font etc. as per your unique business setting.
KPI Dashboard For Tracking Consumer Journey Touchpoints Clipart PDF
This slide covers a touchpoint dashboard with different customer journey stages. It also includes a detailed evaluation of each stage on the basis of experience, importance, etc. Deliver and pitch your topic in the best possible manner with this KPI Dashboard For Tracking Consumer Journey Touchpoints Clipart PDF. Use them to share invaluable insights on Consumer Journey, Purchasing, Consumer Service and impress your audience. This template can be altered and modified as per your expectations. So, grab it now.

Commercial Marketing KPI With Return On Investment Diagrams PDF
This slide templates covers about trade marketing key performing indicators with website visitors, leads by channel, social media reach with yearly goal achievement.Pitch your topic with ease and precision using this Commercial Marketing KPI With Return On Investment Diagrams PDF. This layout presents information on Marketing Spend, Return Investment, Budget Remaining. It is also available for immediate download and adjustment. So, changes can be made in the color, design, graphics or any other component to create a unique layout.
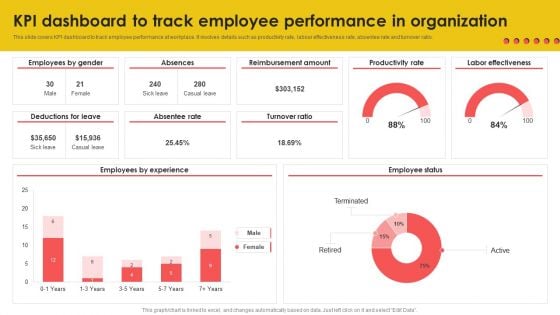
KPI Dashboard To Track Employee Performance In Organization Background PDF
This slide covers KPI dashboard to track employee performance at workplace. It involves details such as productivity rate, labour effectiveness rate, absentee rate and turnover ratio. This KPI Dashboard To Track Employee Performance In Organization Background PDF from Slidegeeks makes it easy to present information on your topic with precision. It provides customization options, so you can make changes to the colors, design, graphics, or any other component to create a unique layout. It is also available for immediate download, so you can begin using it right away. Slidegeeks has done good research to ensure that you have everything you need to make your presentation stand out. Make a name out there for a brilliant performance.
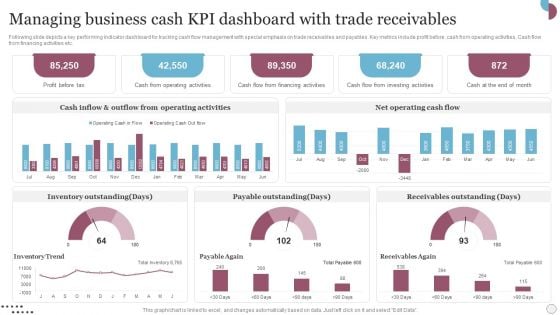
Managing Business Cash Kpi Dashboard With Trade Receivables Slides PDF
Following slide depicts a key performing indicator dashboard for tracking cash flow management with special emphasis on trade receivables and payables. Key metrics include profit before, cash from operating activities, Cash flow from financing activities etc. Showcasing this set of slides titled Managing Business Cash Kpi Dashboard With Trade Receivables Slides PDF. The topics addressed in these templates are Inventory Outstanding, Payable Outstanding, Receivables Outstanding. All the content presented in this PPT design is completely editable. Download it and make adjustments in color, background, font etc. as per your unique business setting.
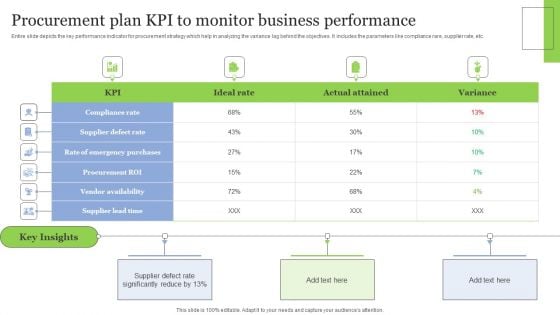
Procurement Plan Kpi To Monitor Business Performance Clipart PDF
Entire slide depicts the key performance indicator for procurement strategy which help in analyzing the variance lag behind the objectives. It includes the parameters like compliance rare, supplier rate, etc. Showcasing this set of slides titled Procurement Plan Kpi To Monitor Business Performance Clipart PDF. The topics addressed in these templates are Key Insights, Vendor Availability, Procurement ROI. All the content presented in this PPT design is completely editable. Download it and make adjustments in color, background, font etc. as per your unique business setting.
Booting Brand Image By Tracking KPI Metrics Diagrams PDF
This slide consists of key performance indicators to be used by mangers to track the brand awareness . Key metrices covered are content reach, brand mention, blog shares, search volume data, repeat purchase and organic traffic. Showcasing this set of slides titled Booting Brand Image By Tracking KPI Metrics Diagrams PDF. The topics addressed in these templates are Content Reach, Brand Mentions, Blog Shares. All the content presented in this PPT design is completely editable. Download it and make adjustments in color, background, font etc. as per your unique business setting.
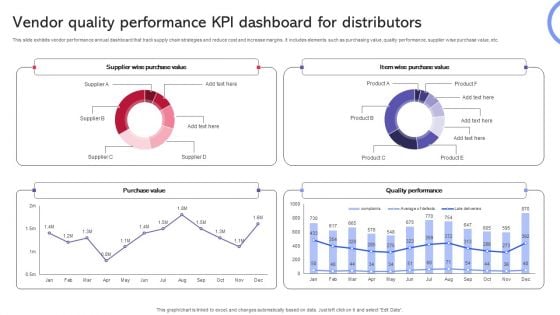
Vendor Quality Performance KPI Dashboard For Distributors Template PDF
This slide exhibits vendor performance annual dashboard that track supply chain strategies and reduce cost and increase margins. It includes elements such as purchasing value, quality performance, supplier wise purchase value, etc. Pitch your topic with ease and precision using this Vendor Quality Performance KPI Dashboard For Distributors Template PDF. This layout presents information on Purchase Value, Quality Performance, Supplier Wise Purchase Value. It is also available for immediate download and adjustment. So, changes can be made in the color, design, graphics or any other component to create a unique layout.
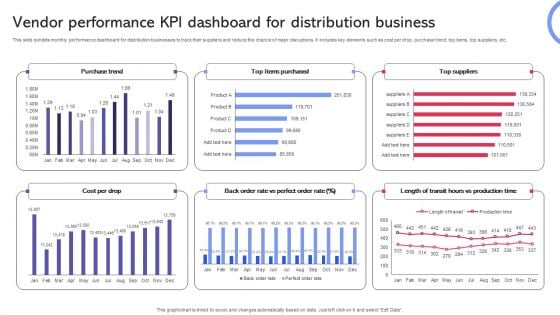
Vendor Performance KPI Dashboard For Distribution Business Formats PDF
This slide exhibits monthly performance dashboard for distribution businesses to track their suppliers and reduce the chance of major disruptions. It includes key elements such as cost per drop, purchase trend, top items, top suppliers, etc. Showcasing this set of slides titled Vendor Performance KPI Dashboard For Distribution Business Formats PDF. The topics addressed in these templates are Purchase Trend, Suppliers, Distribution Business. All the content presented in this PPT design is completely editable. Download it and make adjustments in color, background, font etc. as per your unique business setting.
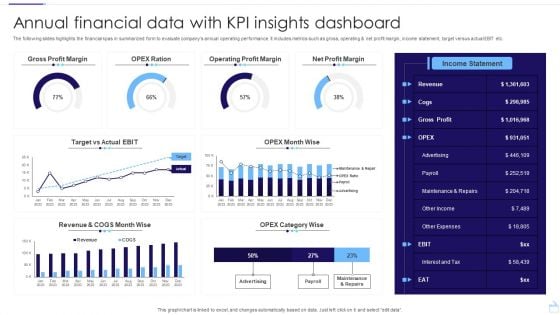
Annual Financial Data With KPI Insights Dashboard Structure PDF
The following slides highlights the financial kpas in summarized form to evaluate companys annual operating performance. It includes metrics such as gross, operating and net profit margin, income statement, target versus actual EBIT etc. Pitch your topic with ease and precision using this Annual Financial Data With KPI Insights Dashboard Structure PDF. This layout presents information on Gross Profit Margin, Operating Profit Margin, Net Profit Margin. It is also available for immediate download and adjustment. So, changes can be made in the color, design, graphics or any other component to create a unique layout.
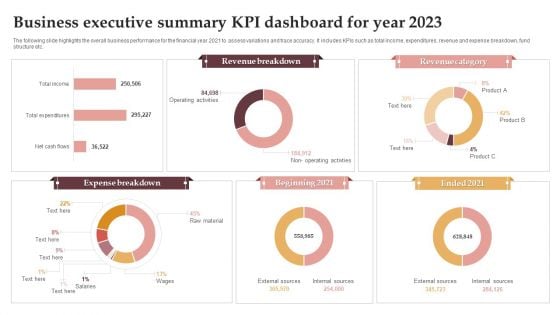
Business Executive Summary KPI Dashboard For Year 2023 Graphics PDF
The following slide highlights the overall business performance for the financial year 2021 to assess variations and trace accuracy. It includes KPIs such as total income, expenditures, revenue and expense breakdown, fund structure etc. Pitch your topic with ease and precision using this Business Executive Summary KPI Dashboard For Year 2023 Graphics PDF. This layout presents information on Revenue Breakdown, Revenue Category, Expense Breakdown. It is also available for immediate download and adjustment. So, changes can be made in the color, design, graphics or any other component to create a unique layout.
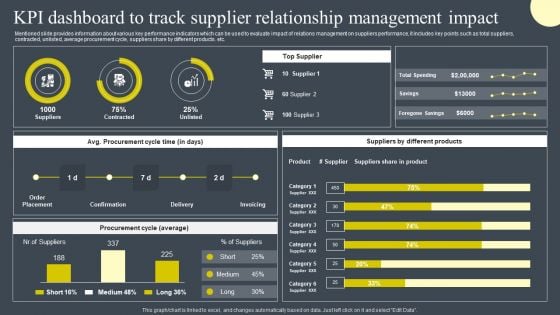
KPI Dashboard To Track Supplier Relationship Management Impact Inspiration PDF
Mentioned slide provides information about various key performance indicators which can be used to evaluate impact of relations management on suppliers performance, it includes key points such as total suppliers, contracted, unlisted, average procurement cycle, suppliers share by different products. etc. Slidegeeks has constructed KPI Dashboard To Track Supplier Relationship Management Impact Inspiration PDF after conducting extensive research and examination. These presentation templates are constantly being generated and modified based on user preferences and critiques from editors. Here, you will find the most attractive templates for a range of purposes while taking into account ratings and remarks from users regarding the content. This is an excellent jumping-off point to explore our content and will give new users an insight into our top-notch PowerPoint Templates.

Maintenance KPI Dashboard Ppt PowerPoint Presentation Complete Deck With Slides
Share a great deal of information on the topic by deploying this Maintenance KPI Dashboard Ppt PowerPoint Presentation Complete Deck With Slides. Support your ideas and thought process with this prefabricated set. It includes a set of twelve slides, all fully modifiable and editable. Each slide can be restructured and induced with the information and content of your choice. You can add or remove large content boxes as well, to make this PPT slideshow more personalized. Its high-quality graphics and visuals help in presenting a well-coordinated pitch. This PPT template is also a resourceful tool to take visual cues from and implement the best ideas to help your business grow and expand. The main attraction of this well-formulated deck is that everything is editable, giving you the freedom to adjust it to your liking and choice. Changes can be made in the background and theme as well to deliver an outstanding pitch. Therefore, click on the download button now to gain full access to this multifunctional set.
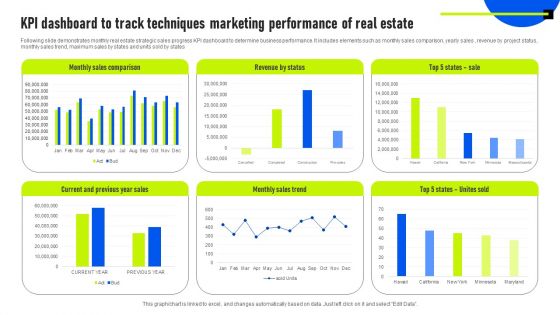
KPI Dashboard To Track Techniques Marketing Performance Of Real Estate Information PDF
Following slide demonstrates monthly real estate strategic sales progress KPI dashboard to determine business performance. It includes elements such as monthly sales comparison, yearly sales , revenue by project status, monthly sales trend, maximum sales by states and units sold by states. Showcasing this set of slides titled KPI Dashboard To Track Techniques Marketing Performance Of Real Estate Information PDF. The topics addressed in these templates are Revenue By Status, Monthly Sales Comparison, Monthly Sales Trend. All the content presented in this PPT design is completely editable. Download it and make adjustments in color, background, font etc. as per your unique business setting.
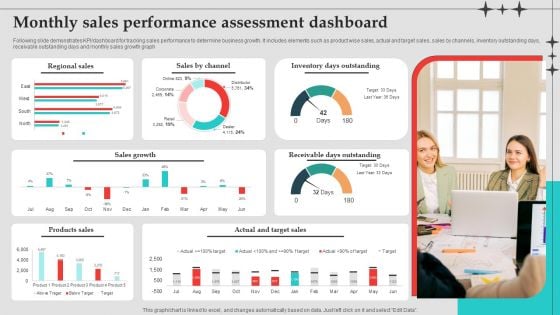
Monthly Sales Performance Assessment Dashboard Download PDF
Following slide demonstrates KPI or dashboard for tracking sales performance to determine business growth. It includes elements such as product wise sales, actual and target sales, sales by channels, inventory outstanding days, receivable outstanding days and monthly sales growth graph. Showcasing this set of slides titled Monthly Sales Performance Assessment Dashboard Download PDF. The topics addressed in these templates are Sales Growth, Inventory Days Outstanding, Target Sales. All the content presented in this PPT design is completely editable. Download it and make adjustments in color, background, font etc. as per your unique business setting.
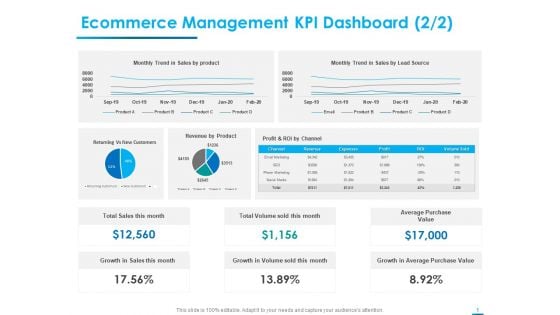
Internet Economy Ecommerce Management KPI Dashboard Trend Ppt Slides Example Topics PDF
Deliver an awe inspiring pitch with this creative internet economy ecommerce management kpi dashboard trend ppt slides example topics pdf bundle. Topics like sales, ecommerce management kpi dashboard can be discussed with this completely editable template. It is available for immediate download depending on the needs and requirements of the user.
Dashboard For Tracking Sales By Various Sales Techniques For Achieving Summary Pdf
This slide covers the KPI dashboard for tracking sales by different categories such as product, region, channel, inventory outstanding, sales growth, actual and target sales, etc. Whether you have daily or monthly meetings, a brilliant presentation is necessary. Dashboard For Tracking Sales By Various Sales Techniques For Achieving Summary Pdf can be your best option for delivering a presentation. Represent everything in detail usingDashboard For Tracking Sales By Various Sales Techniques For Achieving Summary Pdf and make yourself stand out in meetings. The template is versatile and follows a structure that will cater to your requirements. All the templates prepared by Slidegeeks are easy to download and edit. Our research experts have taken care of the corporate themes as well. So, give it a try and see the results. This slide covers the KPI dashboard for tracking sales by different categories such as product, region, channel, inventory outstanding, sales growth, actual and target sales, etc.
Dashboard For Tracking Sales Team Sales Techniques For Achieving Guidelines Pdf
This slide covers the KPI dashboard for tracking sales rep performance. It includes metrics such as sales, target, percent of target, sales, and target for each salesperson. Find highly impressive Dashboard For Tracking Sales Team Sales Techniques For Achieving Guidelines Pdfon Slidegeeks to deliver a meaningful presentation. You can save an ample amount of time using these presentation templates. No need to worry to prepare everything from scratch because Slidegeeks experts have already done a huge research and work for you. You need to download Dashboard For Tracking Sales Team Sales Techniques For Achieving Guidelines Pdf for your upcoming presentation. All the presentation templates are 100 percent editable and you can change the color and personalize the content accordingly. Download now This slide covers the KPI dashboard for tracking sales rep performance. It includes metrics such as sales, target, percent of target, sales, and target for each salesperson.
Interpreting Market Kinetics Influence Customer Purchasing KPI Dashboard To Monitor Icons PDF
Mentioned slide shows the KPI dashboard that can be used to track win and lost sales opportunities. It includes metrics namely won opportunities, lost opportunities, pipeline by territory, total opportunities. Deliver an awe inspiring pitch with this creative interpreting market kinetics influence customer purchasing kpi dashboard to monitor icons pdf bundle. Topics like kpi dashboard to monitor sales opportunities can be discussed with this completely editable template. It is available for immediate download depending on the needs and requirements of the user.
Business Kpi And Benchmarking Competence Results Success Ppt Powerpoint Presentation Icon Graphic Images
This is a business kpi and benchmarking competence results success ppt powerpoint presentation icon graphic images. This is a four stage process. The stages in this process are best practice, best technique, best procedure.
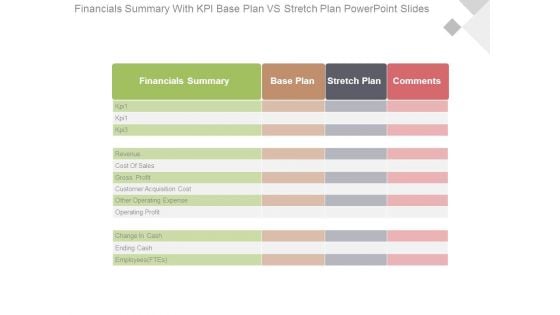
Financials Summary With Kpi Base Plan Vs Stretch Plan Powerpoint Slides
This is a financials summary with kpi base plan vs stretch plan powerpoint slides. This is a four stage process. The stages in this process are financials summary, base plan, stretch plan, comments, kpi 1, kpi 3, revenue, cost of sales, gross profit, customer acquisition cost, other operating expense, operating profit, change in cash, ending cash, employees ftes.
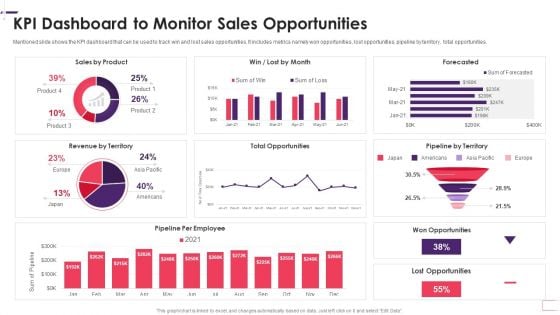
Enhancing Stp Strategies For A Successful Market Promotion Kpi Dashboard To Monitor Diagrams PDF
Mentioned slide shows the KPI dashboard that can be used to track win and lost sales opportunities. It includes metrics namely won opportunities, lost opportunities, pipeline by territory, total opportunities. Deliver and pitch your topic in the best possible manner with this enhancing stp strategies for a successful market promotion kpi dashboard to monitor diagrams pdf. Use them to share invaluable insights on kpi dashboard to monitor sales opportunities and impress your audience. This template can be altered and modified as per your expectations. So, grab it now.
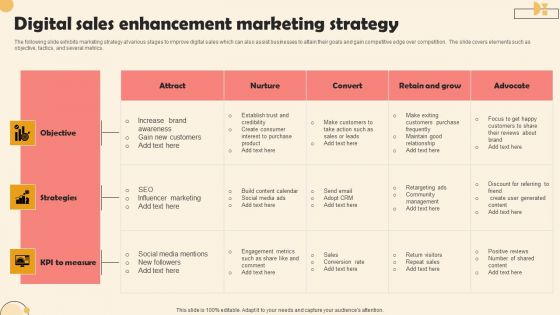
Digital Sales Enhancement Marketing Strategy Inspiration PDF
The following slide exhibits marketing strategy at various stages to improve digital sales which can also assist businesses to attain their goals and gain competitive edge over competition. The slide covers elements such as objective, tactics, and several metrics. Showcasing this set of slides titled Digital Sales Enhancement Marketing Strategy Inspiration PDF. The topics addressed in these templates are Objective, Strategies, KPI Measure. All the content presented in this PPT design is completely editable. Download it and make adjustments in color, background, font etc. as per your unique business setting.
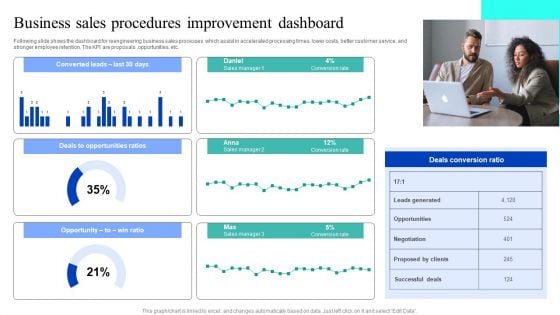
Business Sales Procedures Improvement Dashboard Designs PDF
Following slide shows the dashboard for reengineering business sales processes which assist in accelerated processing times, lower costs, better customer service, and stronger employee retention. The KPI are proposals ,opportunities, etc. Pitch your topic with ease and precision using this Business Sales Procedures Improvement Dashboard Designs PDF. This layout presents information on Deals Opportunities Ratios, Opportunity, Deals Conversion Ratio. It is also available for immediate download and adjustment. So, changes can be made in the color, design, graphics or any other component to create a unique layout.
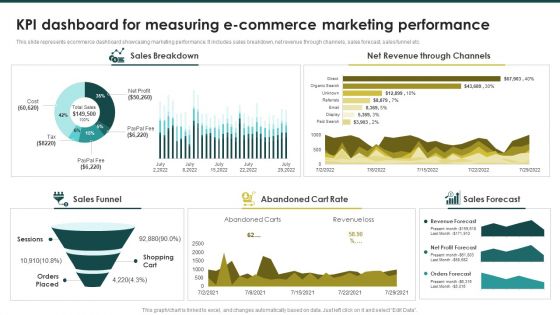
KPI Dashboard For Measuring Ecommerce Marketing Ecommerce Marketing Plan To Enhance Brochure PDF
This slide represents ecommerce dashboard showcasing marketing performance. It includes sales breakdown, net revenue through channels, sales forecast, sales funnel etc.Find highly impressive KPI Dashboard For Measuring Ecommerce Marketing Ecommerce Marketing Plan To Enhance Brochure PDF on Slidegeeks to deliver a meaningful presentation. You can save an ample amount of time using these presentation templates. No need to worry to prepare everything from scratch because Slidegeeks experts have already done a huge research and work for you. You need to download KPI Dashboard For Measuring Ecommerce Marketing Ecommerce Marketing Plan To Enhance Brochure PDF for your upcoming presentation. All the presentation templates are 100precent editable and you can change the color and personalize the content accordingly. Download now.
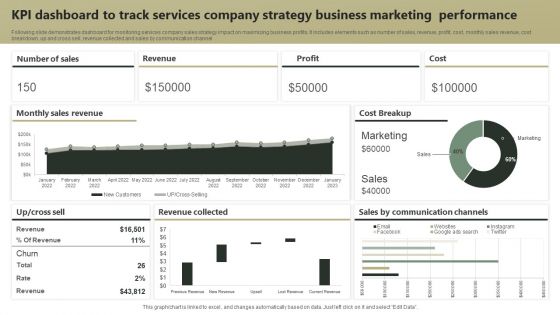
KPI Dashboard To Track Services Company Strategy Business Marketing Performance Guidelines PDF
Following slide demonstrates dashboard for monitoring services company sales strategy impact on maximizing business profits. It includes elements such as number of sales, revenue, profit, cost, monthly sales revenue, cost breakdown, up and cross sell, revenue collected and sales by communication channel. Showcasing this set of slides titled KPI Dashboard To Track Services Company Strategy Business Marketing Performance Guidelines PDF. The topics addressed in these templates are Revenue, Profit, Cost. All the content presented in this PPT design is completely editable. Download it and make adjustments in color, background, font etc. as per your unique business setting.
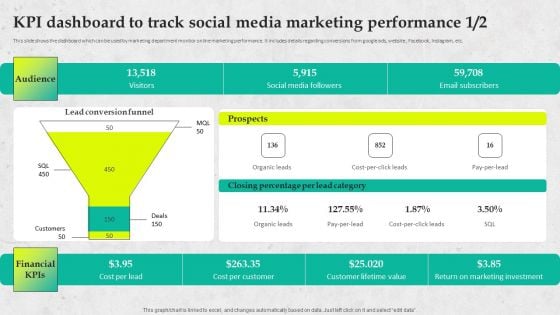
Service Promotion Plan KPI Dashboard To Track Social Media Marketing Performance Slides PDF
This slide shows the dashboard which can be used by marketing department monitor online marketing performance. It includes details regarding conversions from google ads, website , Facebook, Instagram, etc. Crafting an eye-catching presentation has never been more straightforward. Let your presentation shine with this tasteful yet straightforward Service Promotion Plan KPI Dashboard To Track Social Media Marketing Performance Slides PDF template. It offers a minimalistic and classy look that is great for making a statement. The colors have been employed intelligently to add a bit of playfulness while still remaining professional. Construct the ideal Service Promotion Plan KPI Dashboard To Track Social Media Marketing Performance Slides PDF that effortlessly grabs the attention of your audience Begin now and be certain to wow your customers.
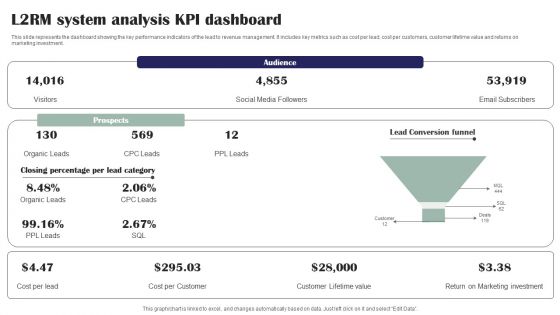
L2RM System Analysis KPI Dashboard Ppt PowerPoint Presentation File Microsoft PDF
This slide represents the dashboard showing the key performance indicators of the lead to revenue management. It includes key metrics such as cost per lead, cost per customers, customer lifetime value and returns on marketing investment. Presenting L2RM System Analysis KPI Dashboard Ppt PowerPoint Presentation File Microsoft PDF to dispense important information. This template comprises one stages. It also presents valuable insights into the topics including Audience, Prospects, Lead Conversion Funnel. This is a completely customizable PowerPoint theme that can be put to use immediately. So, download it and address the topic impactfully.
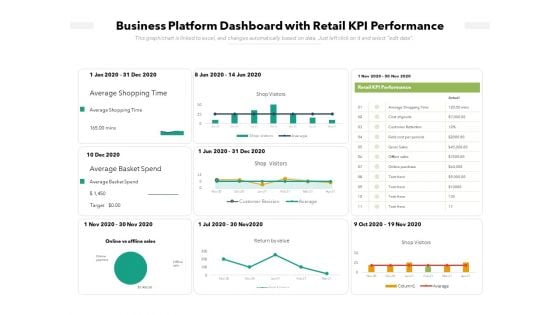
Business Platform Dashboard With Retail KPI Performance Ppt PowerPoint Presentation Slides Diagrams PDF
Pitch your topic with ease and precision using this business platform dashboard with retail kpi performance ppt powerpoint presentation slides diagrams pdf. This layout presents information on retail kpi performance, business platform dashboard with retail kpi performance, online vs offline sales, shop visitors. It is also available for immediate download and adjustment. So, changes can be made in the color, design, graphics or any other component to create a unique layout.
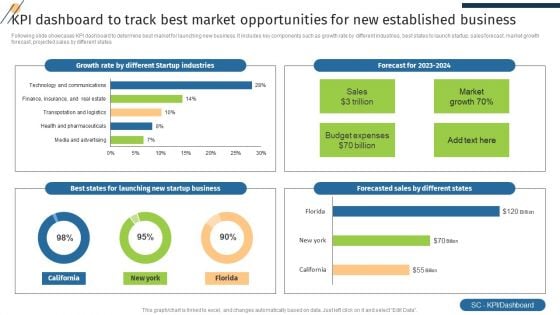
KPI Dashboard To Track Best Market Opportunities For New Established Business Pictures PDF
Following slide showcases KPI dashboard to determine best market for launching new business. It includes key components such as growth rate by different industries, best states to launch startup, sales forecast, market growth forecast, projected sales by different states. Showcasing this set of slides titled KPI Dashboard To Track Best Market Opportunities For New Established Business Pictures PDF. The topics addressed in these templates are Forecasted Sales, Growth Rate, Startup Industries. All the content presented in this PPT design is completely editable. Download it and make adjustments in color, background, font etc. as per your unique business setting.
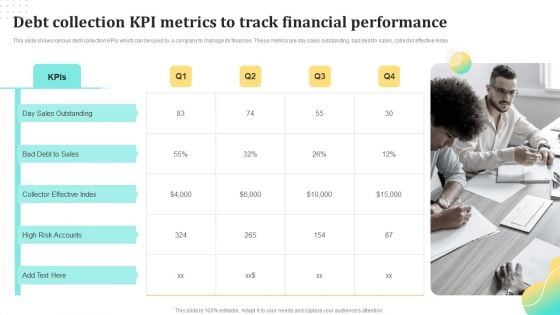
Debt Collection Kpi Metrics To Track Financial Performance Ppt Show Elements PDF
This slide shows various debt collection KPIs which can be used by a company to manage its finances. These metrics are day sales outstanding, bad debt to sales, collector effective Index. Persuade your audience using this Debt Collection Kpi Metrics To Track Financial Performance Ppt Show Elements PDF. This PPT design covers four stages, thus making it a great tool to use. It also caters to a variety of topics including Day Sales Outstanding, Collector Effective Index, High Risk Accounts. Download this PPT design now to present a convincing pitch that not only emphasizes the topic but also showcases your presentation skills.
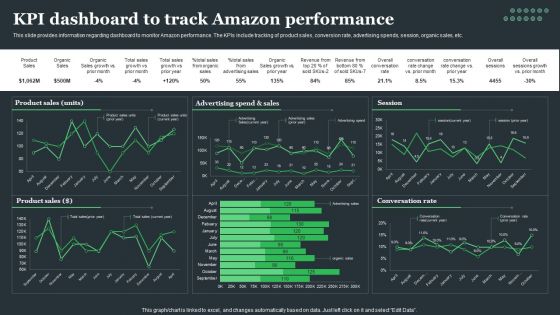
Amazon Tactical Plan KPI Dashboard To Track Amazon Performance Clipart PDF
This slide provides information regarding dashboard to monitor Amazon performance. The KPIs include tracking of product sales, conversion rate, advertising spends, session, organic sales, etc. The Amazon Tactical Plan KPI Dashboard To Track Amazon Performance Clipart PDF is a compilation of the most recent design trends as a series of slides. It is suitable for any subject or industry presentation, containing attractive visuals and photo spots for businesses to clearly express their messages. This template contains a variety of slides for the user to input data, such as structures to contrast two elements, bullet points, and slides for written information. Slidegeeks is prepared to create an impression.
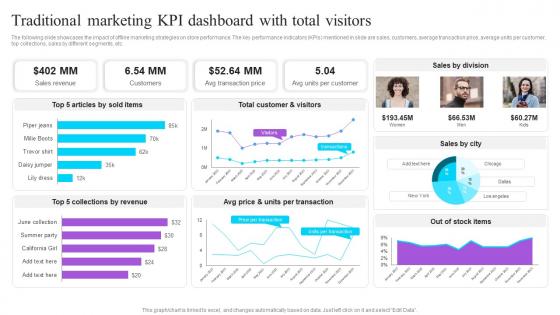
Traditional Marketing KPI Dashboard With Total Visitors Effective GTM Techniques Pictures PDF
The following slide showcases the impact of offline marketing strategies on store performance. The key performance indicators KPIs mentioned in slide are sales, customers, average transaction price, average units per customer, top collections, sales by different segments, etc. Create an editable Traditional Marketing KPI Dashboard With Total Visitors Effective GTM Techniques Pictures PDF that communicates your idea and engages your audience. Whether you are presenting a business or an educational presentation, pre-designed presentation templates help save time. Traditional Marketing KPI Dashboard With Total Visitors Effective GTM Techniques Pictures PDF is highly customizable and very easy to edit, covering many different styles from creative to business presentations. Slidegeeks has creative team members who have crafted amazing templates. So, go and get them without any delay. The following slide showcases the impact of offline marketing strategies on store performance. The key performance indicators KPIs mentioned in slide are sales, customers, average transaction price, average units per customer, top collections, sales by different segments, etc.
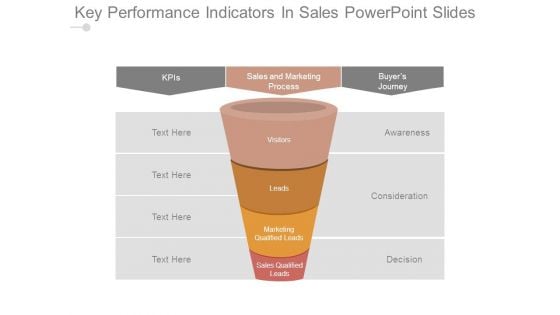
Key Performance Indicators In Sales Powerpoint Slides
This is a key performance indicators in sales powerpoint slides. This is a four stage process. The stages in this process are kpis, sales and marketing process, buyers journey, awareness, consideration, decision, visitors, leads, marketing qualified leads, sales qualified leads.

Metrics To Gauge The Health Of Sales Pipeline Sales Funnel Management Strategies To Increase Sales Elements PDF
This slide shows comparison of sales pipeline metrics Number of deals in sales pipeline, average deal size, win rate etc.of company with the industry average.Deliver an awe inspiring pitch with this creative Metrics To Gauge The Health Of Sales Pipeline Sales Funnel Management Strategies To Increase Sales Elements PDF bundle. Topics like Probability Close, Average Length, Average Deal can be discussed with this completely editable template. It is available for immediate download depending on the needs and requirements of the user.
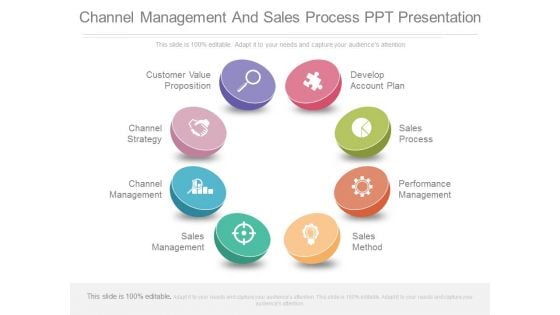
Channel Management And Sales Process Ppt Presentation
This is a channel management and sales process ppt presentation. This is a eight stage process. The stages in this process are marketing, business, process and flows.
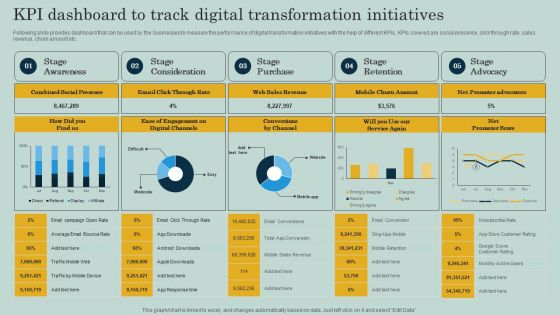
KPI Dashboard To Track Digital Transformation Initiatives Ppt Show Backgrounds PDF
Following slide provides dashboard that can be used by the businesses to measure the performance of digital transformation initiatives with the help of different KPIs. KPIs covered are social presence, click through rate, sales revenue, churn amount etc. The KPI Dashboard To Track Digital Transformation Initiatives Ppt Show Backgrounds PDF is a compilation of the most recent design trends as a series of slides. It is suitable for any subject or industry presentation, containing attractive visuals and photo spots for businesses to clearly express their messages. This template contains a variety of slides for the user to input data, such as structures to contrast two elements, bullet points, and slides for written information. Slidegeeks is prepared to create an impression.
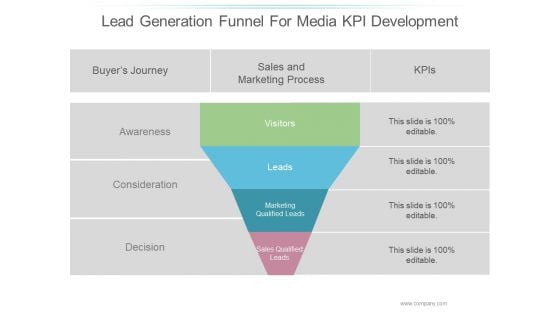
Lead Generation Funnel For Media Kpi Development Ppt PowerPoint Presentation Slide Download
This is a lead generation funnel for media kpi development ppt powerpoint presentation slide download. This is a four stage process. The stages in this process are business, marketing, lego, intelligence, game.
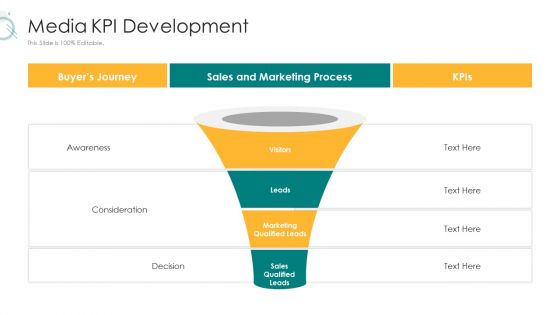
Digital Marketing Strategy And Technological Adaptation Media Kpi Development Structure PDF
This is a digital marketing strategy and technological adaptation media kpi development structure pdf template with various stages. Focus and dispense information on four stages using this creative set, that comes with editable features. It contains large content boxes to add your information on topics like awareness, consideration, decision You can also showcase facts, figures, and other relevant content using this PPT layout. Grab it now.
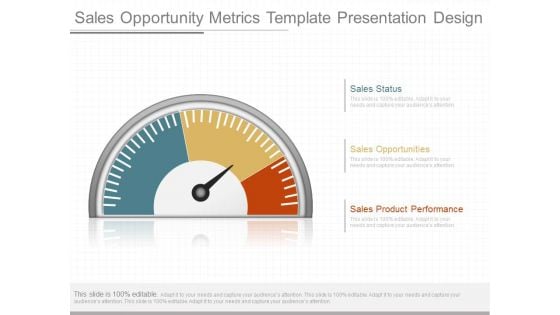
Sales Opportunity Metrics Template Presentation Design
This is a sales opportunity metrics template presentation design. This is a three stage process. The stages in this process are sales status, sales opportunities, sales product performance.
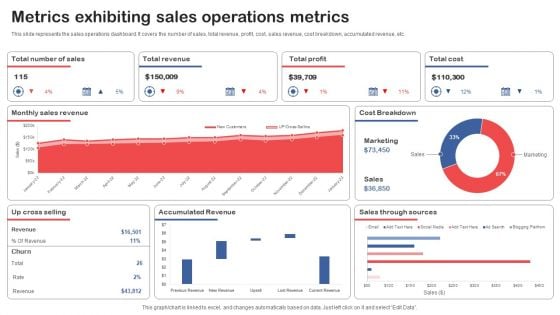
Metrics Exhibiting Sales Operations Metrics Topics PDF
This slide represents the sales operations dashboard. It covers the number of sales, total revenue, profit, cost, sales revenue, cost breakdown, accumulated revenue, etc. Showcasing this set of slides titled Metrics Exhibiting Sales Operations Metrics Topics PDF. The topics addressed in these templates are Total Revenue, Total Profit, Total Cost. All the content presented in this PPT design is completely editable. Download it and make adjustments in color, background, font etc. as per your unique business setting.
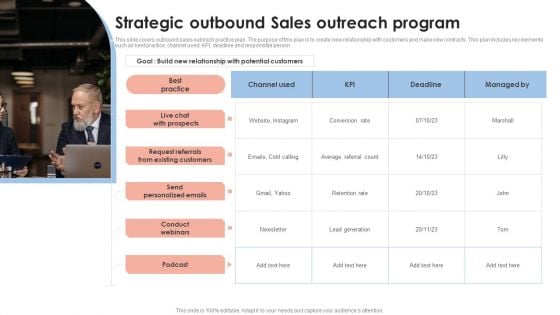
Strategic Outbound Sales Outreach Program Rules PDF
This slide covers outbound sales outreach practice plan. The purpose of this plan is to create new relationship with customers and make new contracts. This plan includes key elements such as best practice, channel used, KPI, deadline and responsible person. Persuade your audience using this Strategic Outbound Sales Outreach Program Rules PDF. This PPT design covers one stages, thus making it a great tool to use. It also caters to a variety of topics including Best Practice, Send Personalized Emails, Conduct Webinars. Download this PPT design now to present a convincing pitch that not only emphasizes the topic but also showcases your presentation skills.

Managing Sales Activities And Results Ppt Inspiration
This is a managing sales activities and results ppt inspiration. This is a four stage process. The stages in this process are define key metrics, manage performance, refine sales accountability system, dissect buying, selling process, science of sales management.

Sales Territory Strategy Plan Ppt Slide Examples
This is a sales territory strategy plan ppt slide examples. This is a six stage process. The stages in this process are sales knowledge, skills art, science metrics, sales strategy, market knowledge, company knowledge.
Sales Incentives Rewards Strategy Icon Topics Pdf
The following slide highlights points like establish metrics, implement performance review, utilize data, reporting tools and culture of accountability to show performance measurement and tracking for sales incentive plan. It helps organizations to optimize performance management, enhance decision making, and drive sales excellence.Showcasing this set of slides titled Sales Incentives Rewards Strategy Icon Topics Pdf The topics addressed in these templates are Sales Incentives, Rewards Strategy Icon All the content presented in this PPT design is completely editable. Download it and make adjustments in color, background, font etc. as per your unique business setting. Our Sales Incentives Rewards Strategy Icon Topics Pdf are topically designed to provide an attractive backdrop to any subject. Use them to look like a presentation pro.
Digital Sales Metrics Showing Enhancement Icons PDF
The following slide represents statistics of online sales key performance indicators KPIs which can assist marketing manager to review their performance and take necessary steps. It include different metrics such as add to cart rate, conversion rate, and revenue per session. Showcasing this set of slides titled Digital Sales Metrics Showing Enhancement Icons PDF. The topics addressed in these templates are Quarterly Online Sales Metrics, Targeted Right Customers, Offered Product Recommendations. All the content presented in this PPT design is completely editable. Download it and make adjustments in color, background, font etc. as per your unique business setting.
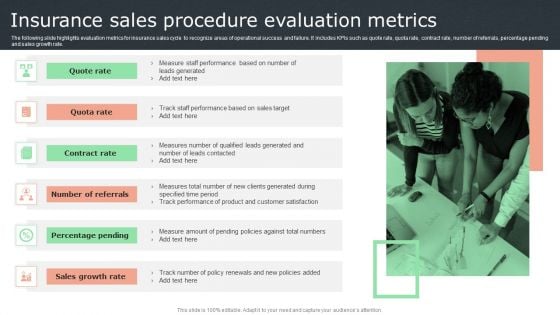
Insurance Sales Procedure Evaluation Metrics Graphics PDF
The following slide highlights evaluation metrics for insurance sales cycle to recognize areas of operational success and failure. It includes KPIs such as quote rate, quota rate, contract rate, number of referrals, percentage pending and sales growth rate. Presenting Insurance Sales Procedure Evaluation Metrics Graphics PDF to dispense important information. This template comprises six stages. It also presents valuable insights into the topics including Contract Rate, Percentage Pending, Sales Growth Rate . This is a completely customizable PowerPoint theme that can be put to use immediately. So, download it and address the topic impactfully.
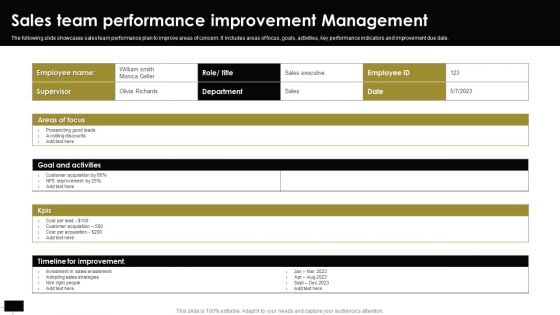
Sales Team Performance Improvement Management Brochure PDF
The following slide showcases sales team performance plan to improve areas of concern. It includes areas of focus, goals, activities, key performance indicators and improvement due date. Showcasing this set of slides titled Sales Team Performance Improvement Management Brochure PDF. The topics addressed in these templates are Customer Acquisition, Goal And Activities, Sales Strategies. All the content presented in this PPT design is completely editable. Download it and make adjustments in color, background, font etc. as per your unique business setting.

 Home
Home