Score Meter
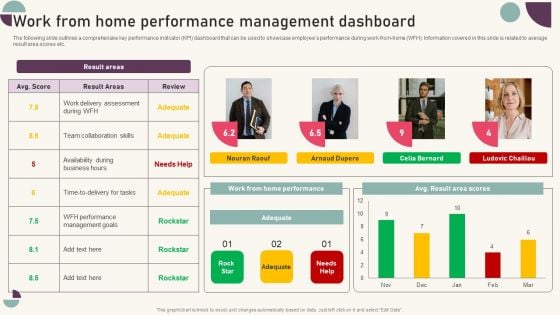
Tactics For Establishing Sustainable Hybrid Work Environment Work From Home Performance Management Dashboard Information PDF
The following slide outlines a comprehensive key performance indicator KPI dashboard that can be used to showcase employees performance during work-from-home WFH. Information covered in this slide is related to average result area scores etc. Want to ace your presentation in front of a live audience Our Tactics For Establishing Sustainable Hybrid Work Environment Work From Home Performance Management Dashboard Information PDF can help you do that by engaging all the users towards you. Slidegeeks experts have put their efforts and expertise into creating these impeccable powerpoint presentations so that you can communicate your ideas clearly. Moreover, all the templates are customizable, and easy to edit and downloadable. Use these for both personal and commercial use.
Work From Home Performance Management Dashboard Icons PDF
The following slide outlines a comprehensive key performance indicator KPI dashboard that can be used to showcase employees performance during work from home WFH. Information covered in this slide is related to average result area scores etc. Do you have to make sure that everyone on your team knows about any specific topic. I yes, then you should give Work From Home Performance Management Dashboard Icons PDF a try. Our experts have put a lot of knowledge and effort into creating this impeccable Work From Home Performance Management Dashboard Icons PDF. You can use this template for your upcoming presentations, as the slides are perfect to represent even the tiniest detail. You can download these templates from the Slidegeeks website and these are easy to edit. So grab these today.
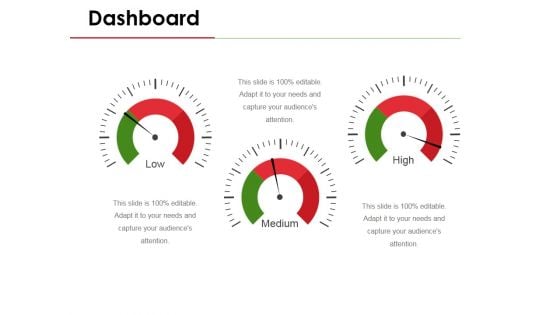
Dashboard Ppt PowerPoint Presentation File Background
This is a dashboard ppt powerpoint presentation file background. This is a three stage process. The stages in this process are speed, meter, business, marketing, equipment.
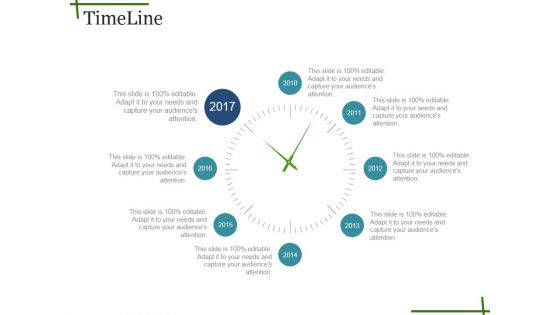
Timeline Ppt PowerPoint Presentation Show Template
This is a timeline ppt powerpoint presentation show template. This is a eight stage process. The stages in this process are measure, years, timeline, meter, watch.
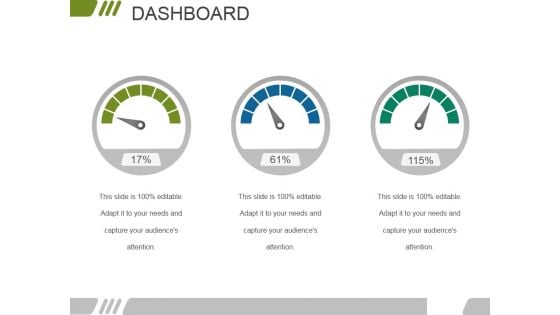
Dashboard Ppt PowerPoint Presentation Visual Aids Professional
This is a dashboard ppt powerpoint presentation visual aids professional. This is a three stage process. The stages in this process are speed, meter, business, marketing, equipment.
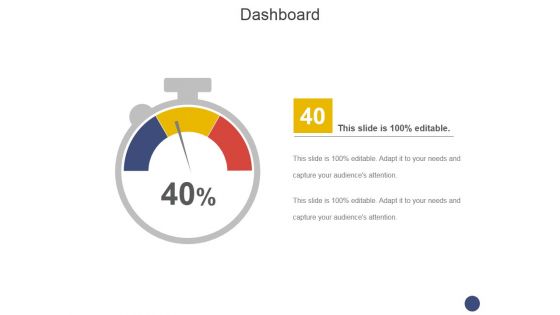
Dashboard Ppt PowerPoint Presentation Layouts Diagrams
This is a dashboard ppt powerpoint presentation layouts diagrams. This is a one stage process. The stages in this process are speed, meter, business, marketing, equipment.
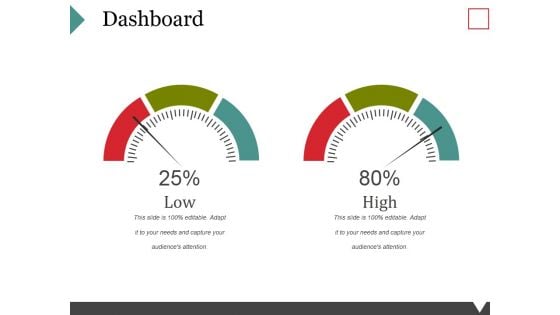
Dashboard Ppt PowerPoint Presentation Pictures Outfit
This is a dashboard ppt powerpoint presentation pictures outfit. This is a two stage process. The stages in this process are speed, meter, business, marketing, equipment.
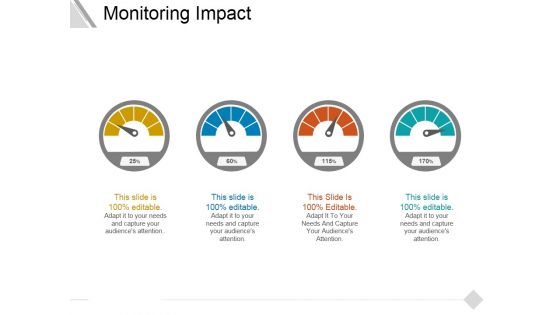
Monitoring Impact Ppt PowerPoint Presentation Ideas Guide
This is a monitoring impact ppt powerpoint presentation ideas guide. This is a four stage process. The stages in this process are speed, meter, business, marketing, equipment.
Balanced Scorecard Leading And Lagging Indicators Powerpoint Slide
This is a balanced scorecard leading and lagging indicators powerpoint slide. This is a four stage process. The stages in this process are dashboard, business, marketing, technology, meter.

Three Dashboard For Financial Reporting Ppt Summary
This is a three dashboard for financial reporting ppt summary. This is a three stage process. The stages in this process are business, marketing, speed, dashboard, meter.

Customer Service Team Review Dashboard Powerpoint Slide Rules
This is a customer service team review dashboard powerpoint slide rules. This is a four stage process. The stages in this process are dashboard, meter, financials, speed, measure.
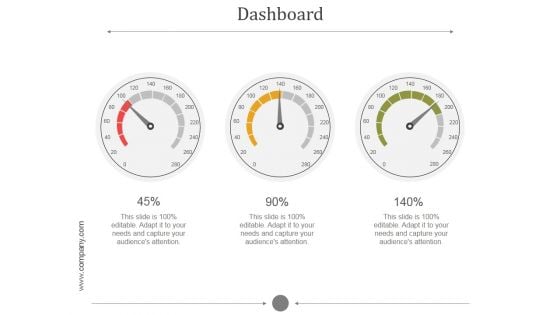
Dashboard Ppt PowerPoint Presentation Show
This is a dashboard ppt powerpoint presentation show. This is a three stage process. The stages in this process are speed, meter, measure, needle, calculate.
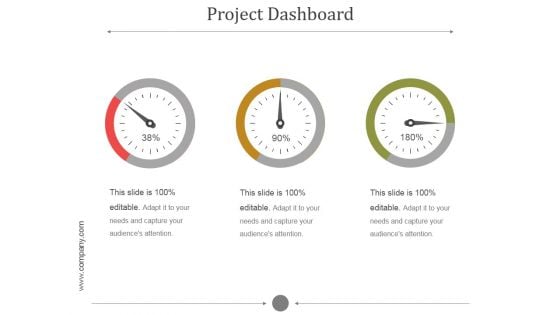
Project Dashboard Ppt PowerPoint Presentation Clipart
This is a project dashboard ppt powerpoint presentation clipart. This is a three stage process. The stages in this process are speed, meter, measure, needle, calculate.
Dashboard Ppt PowerPoint Presentation Microsoft
This is a dashboard ppt powerpoint presentation microsoft. This is a three stage process. The stages in this process are dashboard, business, marketing, speed, meter.
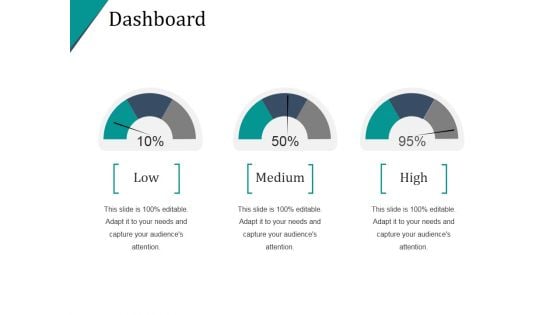
Dashboard Ppt PowerPoint Presentation Images
This is a dashboard ppt powerpoint presentation images. This is a one stage process. The stages in this process are dashboard, meter, speed, measure, business.
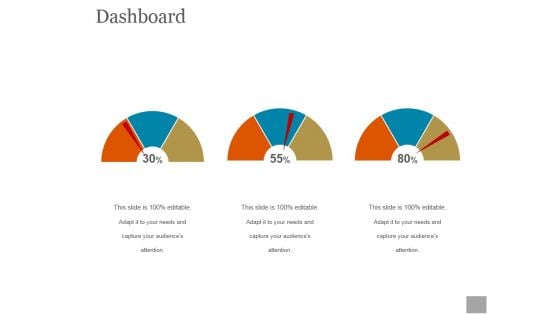
Dashboard Ppt PowerPoint Presentation Styles
This is a dashboard ppt powerpoint presentation styles. This is a three stage process. The stages in this process are dashboard, business, marketing, meter, speed.
Dashboard Ppt PowerPoint Presentation Outline Icon
This is a dashboard ppt powerpoint presentation outline icon. This is a three stage process. The stages in this process are speed, meter, business, marketing, equipment.
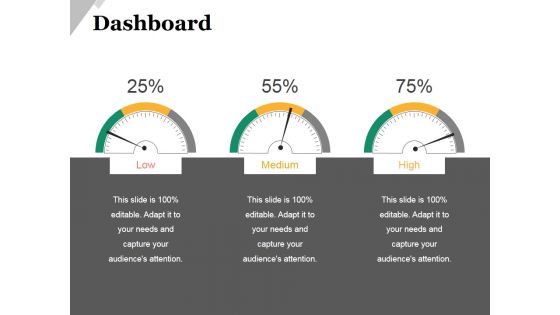
Dashboard Ppt PowerPoint Presentation Layouts Elements
This is a dashboard ppt powerpoint presentation layouts elements. This is a three stage process. The stages in this process are speed, meter, business, marketing, equipment.
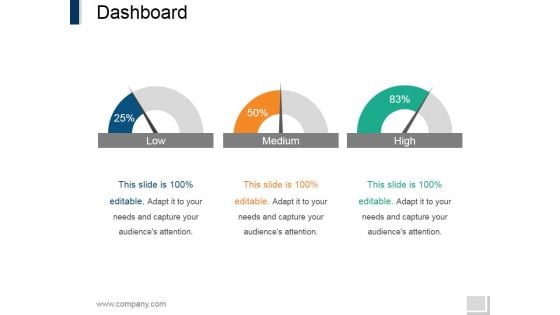
Dashboard Ppt PowerPoint Presentation Pictures Portfolio
This is a dashboard ppt powerpoint presentation pictures portfolio. This is a three stage process. The stages in this process are speed, meter, business, marketing, equipment.
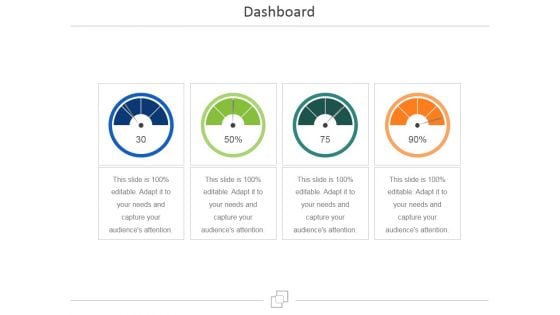
Dashboard Ppt PowerPoint Presentation Infographic Template Model
This is a dashboard ppt powerpoint presentation infographic template model. This is a four stage process. The stages in this process are business, marketing, meter, speed, measure.

Dashboard Ppt PowerPoint Presentation Infographics Introduction
This is a dashboard ppt powerpoint presentation infographics introduction. This is a four stage process. The stages in this process are dashboard, meter, business, marketing, finance.
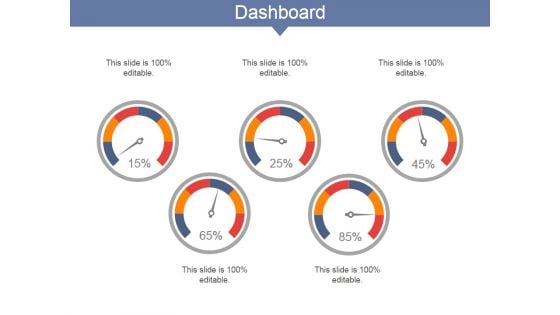
Dashboard Ppt PowerPoint Presentation Model Inspiration
This is a dashboard ppt powerpoint presentation model inspiration. This is a five stage process. The stages in this process are dashboard, business, marketing, strategy, meter.
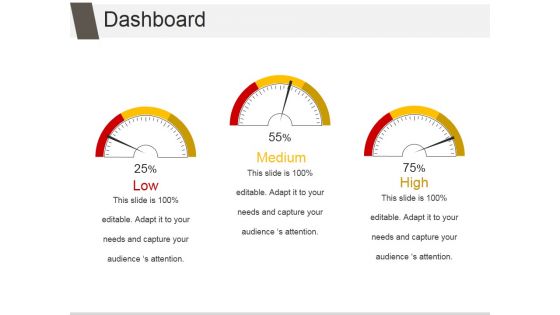
Dashboard Ppt PowerPoint Presentation Inspiration File Formats
This is a dashboard ppt powerpoint presentation inspiration file formats. This is a three stage process. The stages in this process are speed, meter, business, marketing, equipment.
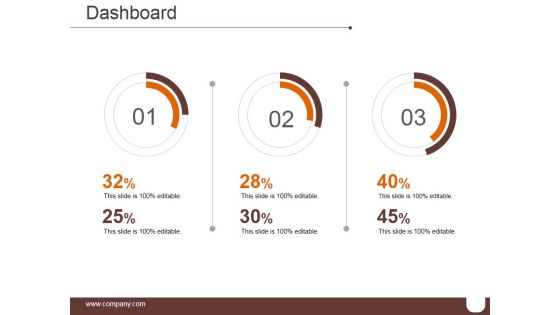
Dashboard Ppt PowerPoint Presentation Infographics Format Ideas
This is a dashboard ppt powerpoint presentation infographics format ideas. This is a three stage process. The stages in this process are speed, meter, business, marketing, equipment.
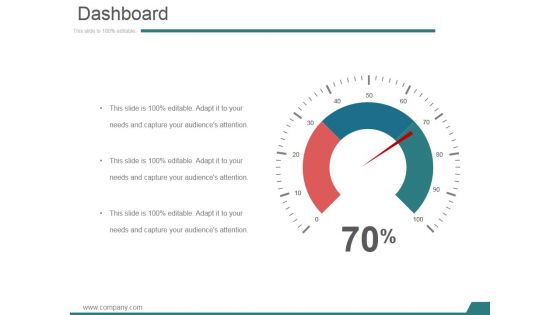
Dashboard Ppt PowerPoint Presentation Infographics Sample
This is a dashboard ppt powerpoint presentation infographics sample. This is a one stage process. The stages in this process are speed, meter, business, marketing, equipment.
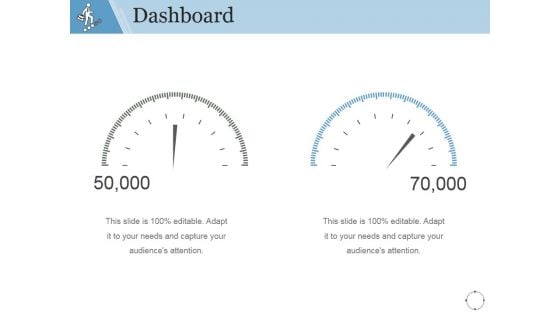
Dashboard Ppt PowerPoint Presentation Gallery Layouts
This is a dashboard ppt powerpoint presentation gallery layouts. This is a two stage process. The stages in this process are speed, meter, business, marketing, equipment.
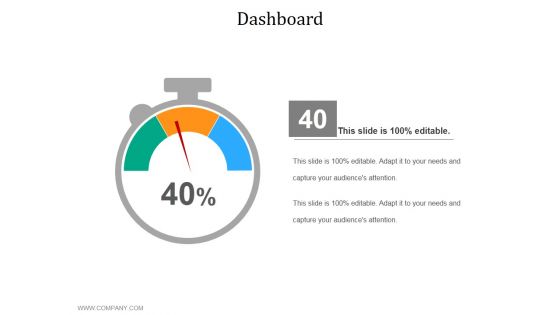
Dashboard Ppt PowerPoint Presentation Summary Example Topics
This is a dashboard ppt powerpoint presentation summary example topics. This is a one stage process. The stages in this process are speed, meter, business, marketing, equipment.
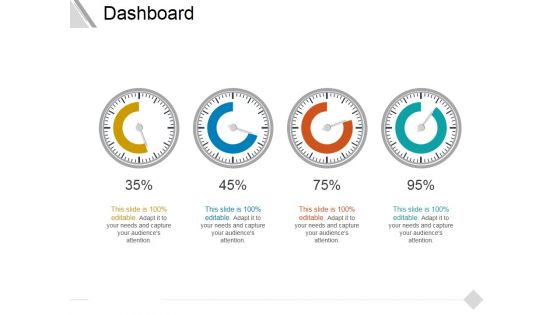
Dashboard Ppt PowerPoint Presentation Slides Styles
This is a dashboard ppt powerpoint presentation slides styles. This is a four stage process. The stages in this process are speed, meter, business, marketing, equipment.
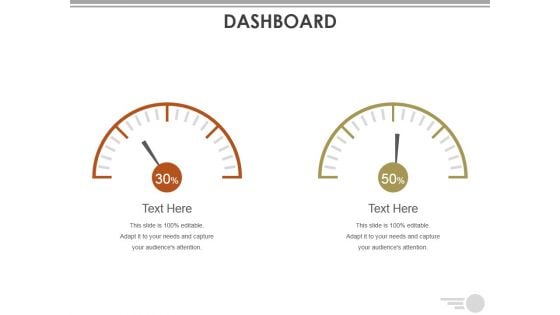
Dashboard Ppt PowerPoint Presentation Portfolio Demonstration
This is a dashboard ppt powerpoint presentation portfolio demonstration. This is a two stage process. The stages in this process are dashboard, finance, percentage, meter, speed.
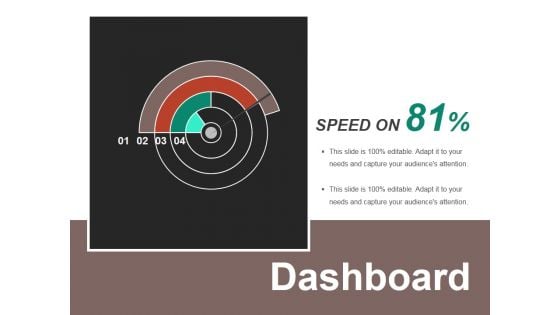
Dashboard Ppt PowerPoint Presentation Summary Format
This is a dashboard ppt powerpoint presentation summary format. This is a one stage process. The stages in this process are speed, meter, dashboard, measure, planning.
Dashboard Ppt PowerPoint Presentation Pictures Icon
This is a dashboard ppt powerpoint presentation pictures icon. This is a six stage process. The stages in this process are dashboard, meter, measure, speed, marketing.
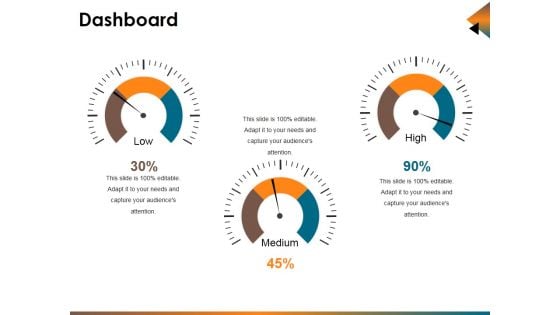
Dashboard Ppt PowerPoint Presentation Model Layout
This is a dashboard ppt powerpoint presentation model layout. This is a three stage process. The stages in this process are dashboard, meter, finance, speed, marketing.
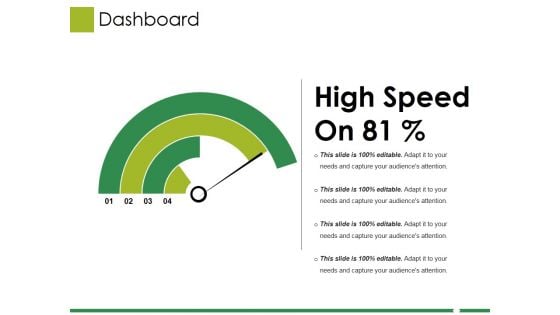
Dashboard Ppt PowerPoint Presentation Model Slide Download
This is a dashboard ppt powerpoint presentation model slide download. This is a one stage process. The stages in this process are finance, planning, meter, speed, dashboard.
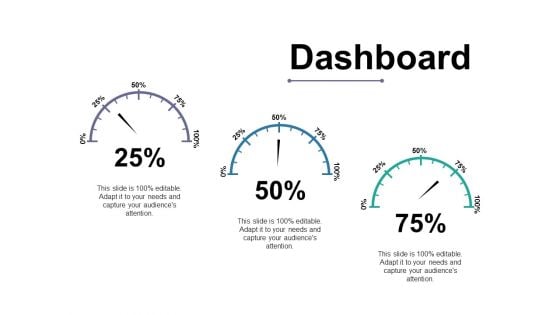
Dashboard Ppt PowerPoint Presentation Styles Themes
This is a dashboard ppt powerpoint presentation styles themes. This is a three stage process. The stages in this process are dashboard, speed, meter, business, marketing.
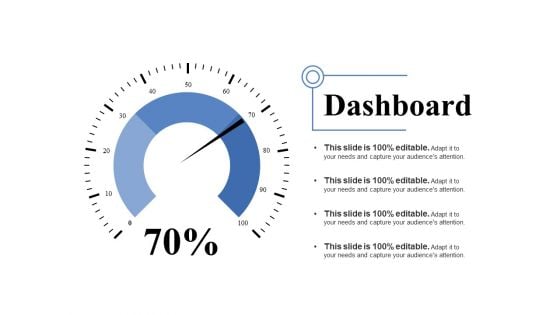
Dashboard Ppt PowerPoint Presentation Summary Maker
This is a dashboard ppt powerpoint presentation summary maker. This is a one stage process. The stages in this process are dashboard, marketing, speed, planning, meter.
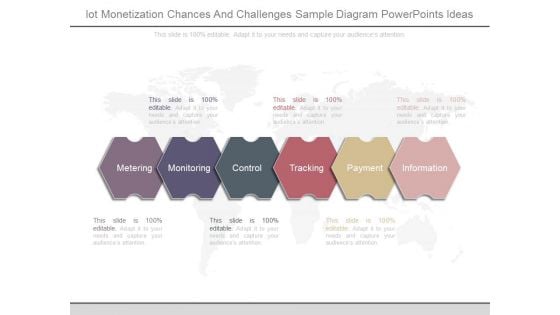
Iot Monetization Chances And Challenges Sample Diagram Powerpoints Ideas
This is a iot monetization chances and challenges sample diagram powerpoints ideas. This is a six stage process. The stages in this process are metering, monitoring, control, tracking, payment, information.
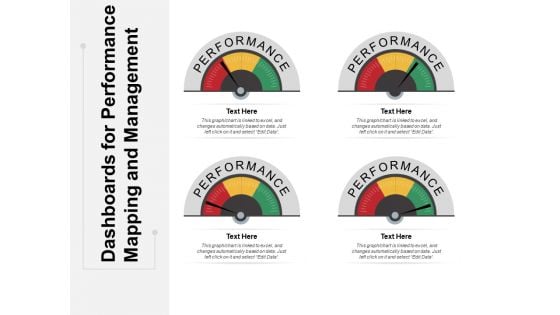
Dashboards For Performance Mapping And Management Ppt PowerPoint Presentation Ideas File Formats
This is a dashboards for performance mapping and management ppt powerpoint presentation ideas file formats. This is a four stage process. The stages in this process are performance dashboard, performance meter, performance kpi.
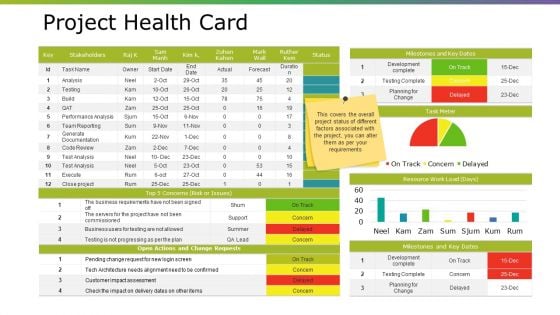
Project Health Card Ppt PowerPoint Presentation Summary Example
This is a project health card ppt powerpoint presentation summary example. This is a seven stage process. The stages in this process are development complete, testing complete, planning for change, milestones and key dates, task meter.

Key Performance Indicators Template 1 Ppt PowerPoint Presentation Styles Mockup
This is a key performance indicators template 1 ppt powerpoint presentation styles mockup. This is a four stage process. The stages in this process are dashboard, meter, business, marketing, speed.
Customer Satisfaction Levels High Medium Low Indicator Dashboard Ppt PowerPoint Presentation Icon Show
This is a customer satisfaction levels high medium low indicator dashboard ppt powerpoint presentation icon show. This is a six stage process. The stages in this process are performance dashboard, performance meter, performance kpi.

Low High Performance Measurement Indicator Dashboard Ppt PowerPoint Presentation Summary Images
This is a low high performance measurement indicator dashboard ppt powerpoint presentation summary images. This is a five stage process. The stages in this process are performance dashboard, performance meter, performance kpi.
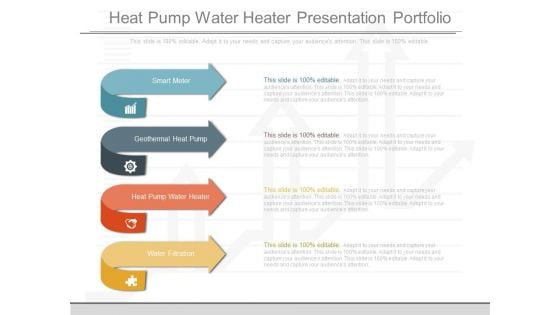
Heat Pump Water Heater Presentation Portfolio
This is a heat pump water heater presentation portfolio. This is a four stage process. The stages in this process are smart meter, geothermal heat pump, heat pump water heater, water filtration.

Small Wind Powerpoint Slide Presentation Guidelines
This is a small wind powerpoint slide presentation guidelines. This is a four stage process. The stages in this process are heat pump water heater, geothermal heat pump, small wind, smart meter.
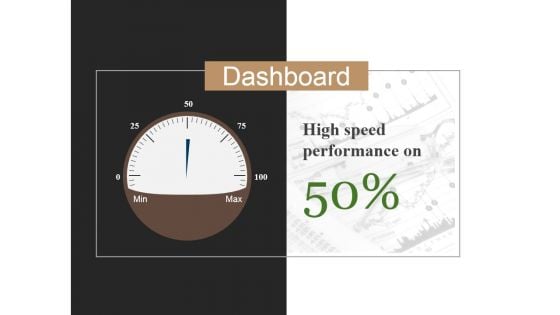
Dashboard Ppt PowerPoint Presentation File Slide
This is a dashboard ppt powerpoint presentation file slide. This is a one stage process. The stages in this process are high speed performance on, business, marketing, meter, measure.
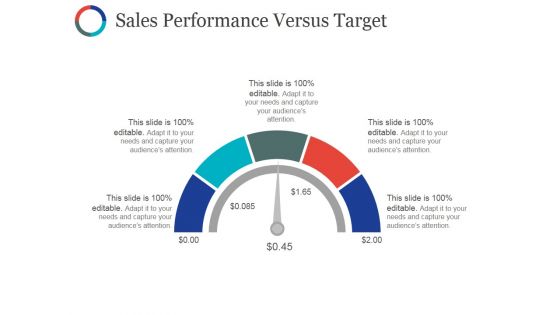
Sales Performance Versus Target Ppt PowerPoint Presentation File Vector
This is a sales performance versus target ppt powerpoint presentation file vector. This is a five stage process. The stages in this process are business, marketing, speed, meter, sales.
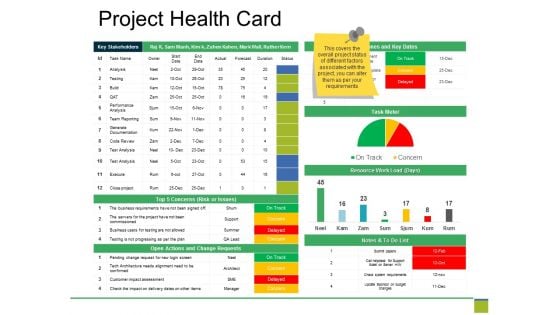
Project Health Card Ppt PowerPoint Presentation Pictures Design Templates
This is a project health card ppt powerpoint presentation pictures design templates. This is a seven stage process. The stages in this process are key stakeholders, milestones and key dates, task meter, submit papers, check system requirements.
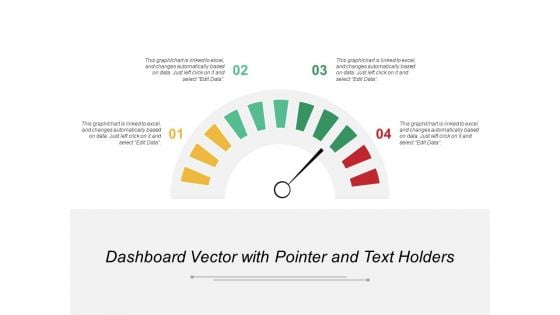
Dashboard Vector With Pointer And Text Holders Ppt PowerPoint Presentation Portfolio Format Ideas
This is a dashboard vector with pointer and text holders ppt powerpoint presentation portfolio format ideas. This is a four stage process. The stages in this process are performance dashboard, performance meter, performance kpi.
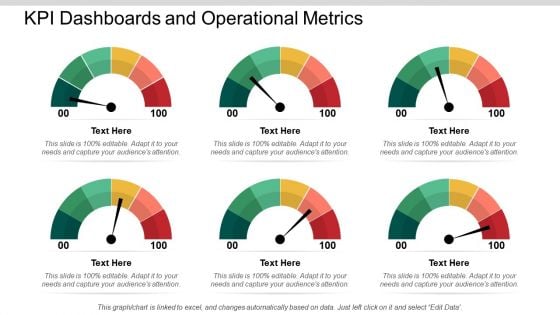
KPI Dashboards And Operational Metrics Ppt PowerPoint Presentation Portfolio Infographics

Liquid Gauge Symbol Digital Water Digital Reading Control Gauge Ppt PowerPoint Presentation Complete Deck
Presenting this set of slides with name liquid gauge symbol digital water digital reading control gauge ppt powerpoint presentation complete deck. The topics discussed in these slides are digital water, digital reading, control gauge, water meter. This is a completely editable PowerPoint presentation and is available for immediate download. Download now and impress your audience.
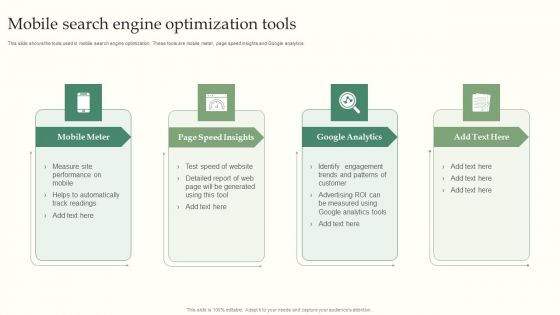
Mobile Search Engine Optimization Tools Background PDF
This slide shows the tools used in mobile search engine optimization. These tools are mobile meter, page speed insights and Google analytics. Persuade your audience using this Mobile Search Engine Optimization Tools Background PDF. This PPT design covers four stages, thus making it a great tool to use. It also caters to a variety of topics including Mobile Meter, Page Speed Insights, Google Analytics. Download this PPT design now to present a convincing pitch that not only emphasizes the topic but also showcases your presentation skills.
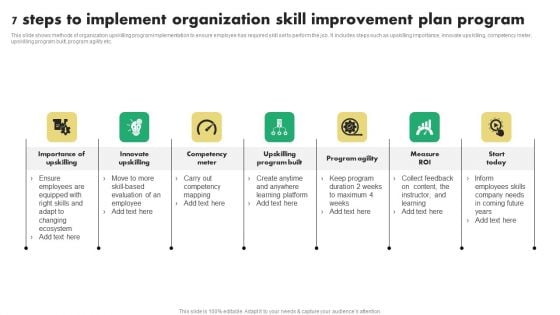
7 Steps To Implement Organization Skill Improvement Plan Program Infographics PDF
This slide shows methods of organization upskilling program implementation to ensure employee has required skill set to perform the job. It includes steps such as upskilling importance, innovate upskilling, competency meter, upskilling program built, program agility etc. Presenting 7 Steps To Implement Organization Skill Improvement Plan Program Infographics PDF to dispense important information. This template comprises seven stages. It also presents valuable insights into the topics including Competency Meter, Innovate Upskilling, Program Agility. This is a completely customizable PowerPoint theme that can be put to use immediately. So, download it and address the topic impactfully.
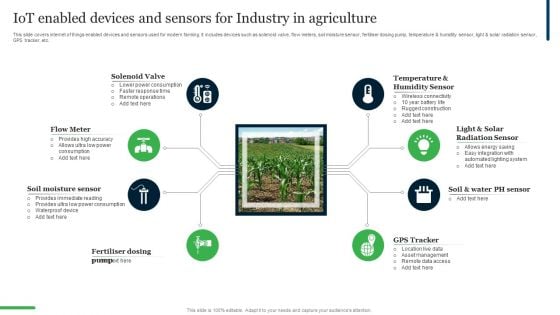
Iot Enabled Devices And Sensors For Industry In Agriculture Ppt PowerPoint Presentation Gallery Show PDF
This slide covers internet of things enabled devices and sensors used for modern farming. It includes devices such as solenoid valve, flow meters, soil moisture sensor, fertiliser dosing pump, temperature and humidity sensor, light ans solar radiation sensor, GPS tracker, etc. Presenting Iot Enabled Devices And Sensors For Industry In Agriculture Ppt PowerPoint Presentation Gallery Show PDF to dispense important information. This template comprises eight stages. It also presents valuable insights into the topics including Solenoid Valve, Flow Meter, Soil Moisture Sensor. This is a completely customizable PowerPoint theme that can be put to use immediately. So, download it and address the topic impactfully.
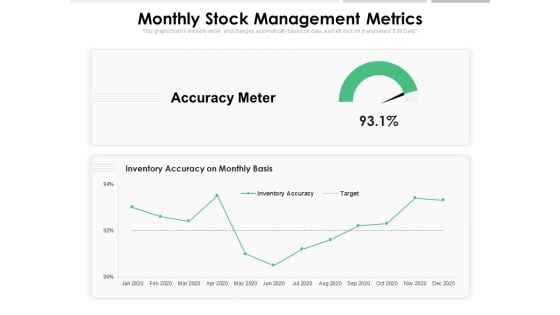
Monthly Stock Management Metrics Ppt PowerPoint Presentation Inspiration Format PDF
Presenting this set of slides with name monthly stock management metrics ppt powerpoint presentation inspiration format pdf. The topics discussed in these slides are accuracy meter, inventory accuracy on monthly basis, target. This is a completely editable PowerPoint presentation and is available for immediate download. Download now and impress your audience.
Inventory Management Metrics With Out Of Stock Items Ppt PowerPoint Presentation Icon Images PDF
Presenting this set of slides with name inventory management metrics with out of stock items ppt powerpoint presentation icon images pdf. The topics discussed in these slides are carrying cost of inventory, inventory accuracy, out of stock items, inventory turnover last 5 years, accuracy meter. This is a completely editable PowerPoint presentation and is available for immediate download. Download now and impress your audience.
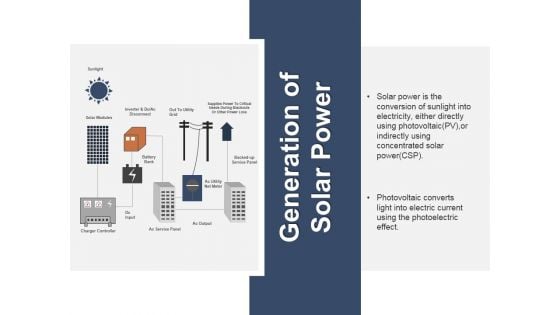
Generation Of Solar Power Ppt PowerPoint Presentation Pictures Portrait
This is a generation of solar power ppt powerpoint presentation pictures portrait. This is a two stage process. The stages in this process are solar modules, inverter and dc ac disconnect, out to utility grid, backed up service panel, ac utility net meter, ac output, ac service panel.
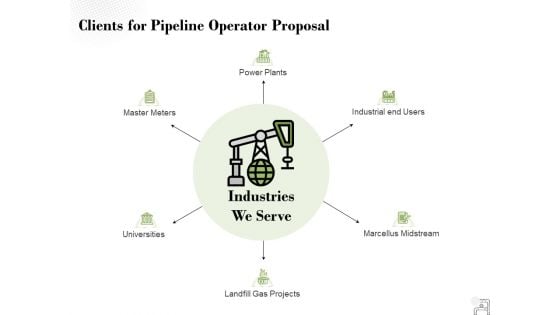
Clients For Pipeline Operator Proposal Ppt PowerPoint Presentation Slides Ideas
Presenting this set of slides with name clients for pipeline operator proposal ppt powerpoint presentation slides ideas. This is a six stage process. The stages in this process are industries, we serve landfill gas projects, marcellus midstream, industrial end users, power plants, master meters, universities. This is a completely editable PowerPoint presentation and is available for immediate download. Download now and impress your audience.
Example Of Asset Vision Platform Highlights Ppt Powerpoint Show
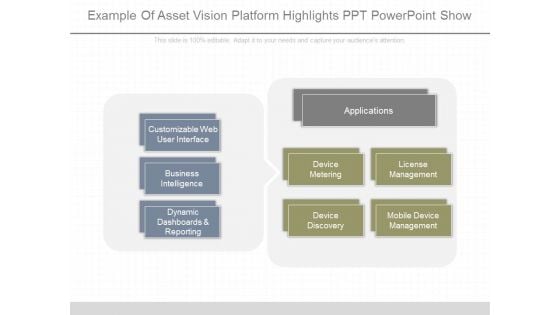
This is a example of asset vision platform highlights ppt powerpoint show. This is a two stage process. The stages in this process are customizable web user interface, business intelligence, dynamic dashboards and reporting, applications, device metering, license management, device discovery, mobile device management.
Current State Optimization Procedure To Create Desired Results Portrait PDF
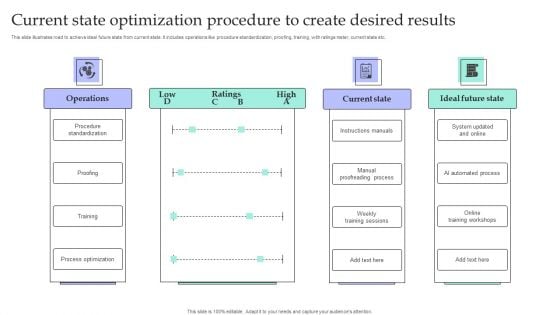
This slide illustrates road to achieve ideal future state from current state. It includes operations like procedure standardization, proofing, training, with ratings meter, current state etc.Showcasing this set of slides titled Current State Optimization Procedure To Create Desired Results Portrait PDF. The topics addressed in these templates are Procedure Standardization, Proofreading Process, Process Optimization. All the content presented in this PPT design is completely editable. Download it and make adjustments in color, background, font etc. as per your unique business setting.
Ideal Future From Current State Gap Optimization Strategy Brochure PDF
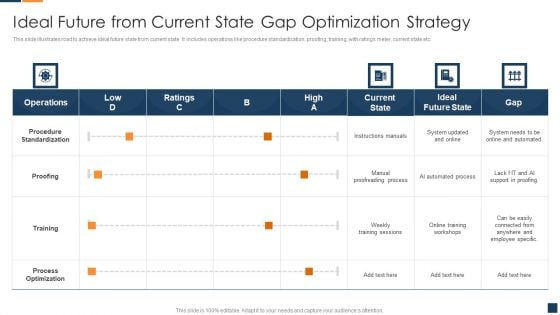
This slide illustrates road to achieve ideal future state from current state. It includes operations like procedure standardization, proofing, training, with ratings meter, current state etc. Showcasing this set of slides titled Ideal Future From Current State Gap Optimization Strategy Brochure PDF. The topics addressed in these templates are Procedure Standardization, Process Optimization, Proofreading Process. All the content presented in this PPT design is completely editable. Download it and make adjustments in color, background, font etc. as per your unique business setting
Kpis To Measure Effectiveness Of Workforce Experience Strategy Ppt PowerPoint Presentation File Ideas PDF
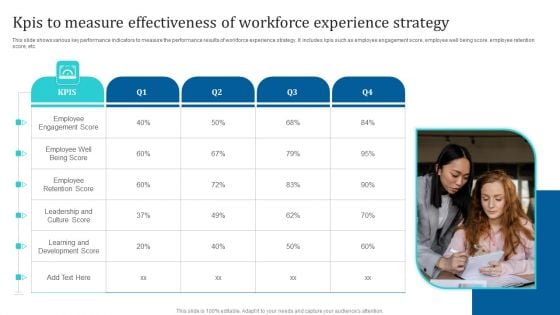
This slide shows various key performance indicators to measure the performance results of workforce experience strategy. It includes kpis such as employee engagement score, employee well being score, employee retention score, etc. Presenting Kpis To Measure Effectiveness Of Workforce Experience Strategy Ppt PowerPoint Presentation File Ideas PDF to dispense important information. This template comprises four stages. It also presents valuable insights into the topics including Employee Engagement Score, Employee Retention Score, Culture Score. This is a completely customizable PowerPoint theme that can be put to use immediately. So, download it and address the topic impactfully.

 Home
Home