Speedometer
Business Plan Future PowerPoint Presentation Slides C
Microsoft Powerpoint Slides and Backgrounds with a speedometer needle speeds past the various stages of getting a job the resume the interview and success Earn the credits you do deserve. Answer the critics with our Business Plan Future PowerPoint Presentation Slides C.
Business Plan Future PowerPoint Presentation Slides Cc
Microsoft Powerpoint Slides and Backgrounds with a speedometer needle speeds past the various stages of getting a job the resume the interview and success Establish your knowledge of the system. Trace the circuit with our Business Plan Future PowerPoint Presentation Slides Cc.
Business Plan Future PowerPoint Presentation Slides F
Microsoft Powerpoint Slides and Backgrounds with a speedometer needle speeds past the various stages of getting a job the resume the interview and success Win applauses with our Business Plan Future PowerPoint Presentation Slides F. You will come out on top.
Business Plan Future PowerPoint Presentation Slides R
Microsoft Powerpoint Slides and Backgrounds with a speedometer needle speeds past the various stages of getting a job the resume the interview and success Find the right words to convey your ideas. Get it exact with our Business Plan Future PowerPoint Presentation Slides R.
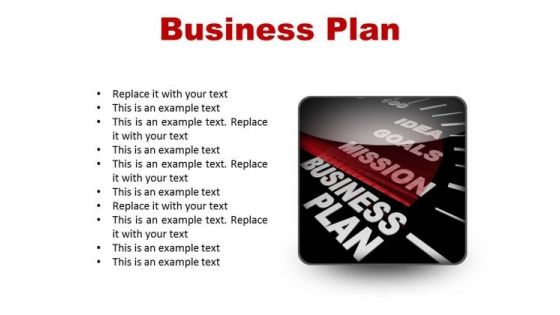
Business Plan Future PowerPoint Presentation Slides S
Microsoft Powerpoint Slides and Backgrounds with a speedometer needle speeds past the various stages of getting a job the resume the interview and success Your ideas deserve more exposure. Our Business Plan Future PowerPoint Presentation Slides S will ensure due coverage.

Business Diagram Three Meters For Speed Control Presentation Template
Graphic of three speedometers has been used to design this power point template. This diagram contains the concept of speed control. Amplify your thoughts via this appropriate business template.
Dashboards For Measuring Business Performance Ppt Icon
This is a dashboards for measuring business performance ppt icon. This is a three stage process. The stages in this process are dashboard, measuring, management, speedometer, icons, strategy.
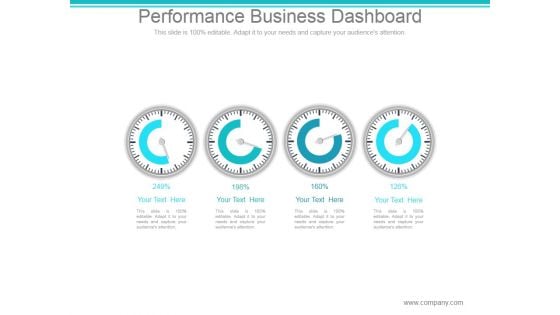
Performance Business Dashboard Ppt PowerPoint Presentation Visuals
This is a performance business dashboard ppt powerpoint presentation visuals. This is a four stage process. The stages in this process are dashboard, speedometer, report, business, marketing.
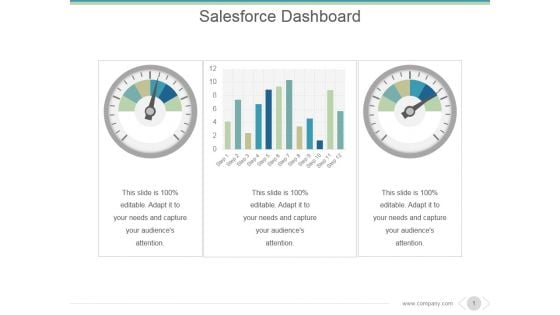
Salesforce Dashboard Ppt PowerPoint Presentation Summary
This is a salesforce dashboard ppt powerpoint presentation summary. This is a two stage process. The stages in this process are business, marketing, dashboard, graph, speedometer.
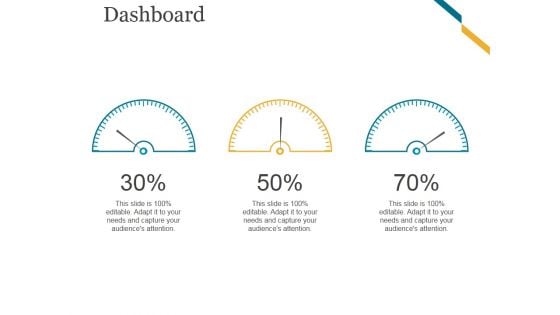
Dashboard Ppt PowerPoint Presentation Infographic Template Tips
This is a dashboard ppt powerpoint presentation infographic template tips. This is a three stage process. The stages in this process are speedometer, dashboard, business, marketing, equipment.
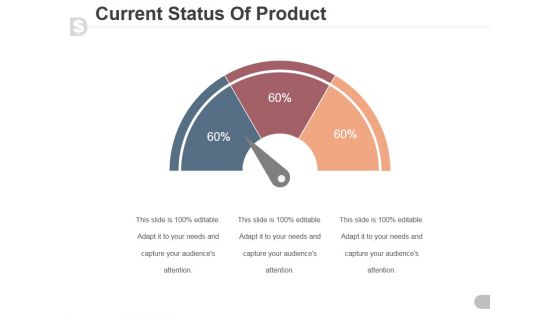
Current Status Of Product Ppt PowerPoint Presentation Designs Download
This is a current status of product ppt powerpoint presentation designs download. This is a three stage process. The stages in this process are speedometer, dashboard, business, marketing, finance.
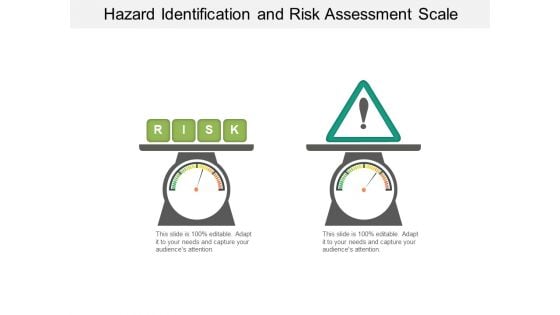
Hazard Identification And Risk Assessment Scale Ppt PowerPoint Presentation File Aids
This is a hazard identification and risk assessment scale ppt powerpoint presentation file aids. This is a two stage process. The stages in this process are risk meter, risk speedometer, hazard meter.

Hazard Meter Showing Three Danger Levels Ppt PowerPoint Presentation Infographic Template Examples
This is a hazard meter showing three danger levels ppt powerpoint presentation infographic template examples. This is a five stage process. The stages in this process are risk meter, risk speedometer, hazard meter.
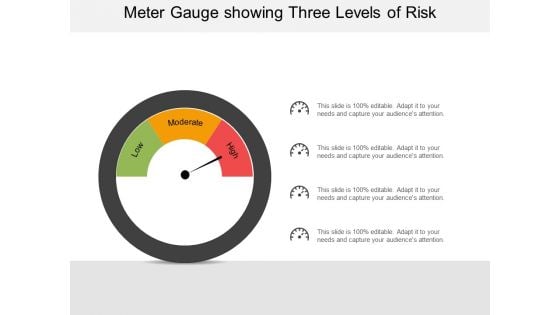
Meter Gauge Showing Three Levels Of Risk Ppt PowerPoint Presentation Pictures Graphics
This is a meter gauge showing three levels of risk ppt powerpoint presentation pictures graphics. This is a four stage process. The stages in this process are risk meter, risk speedometer, hazard meter.
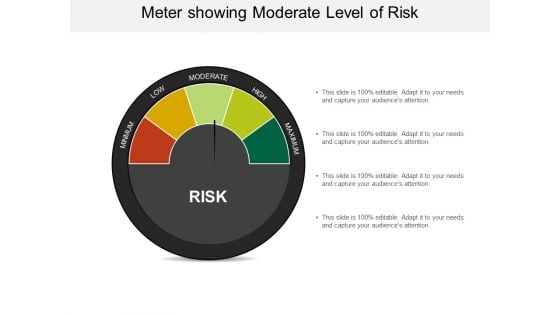
Meter Showing Moderate Level Of Risk Ppt PowerPoint Presentation Model Summary
This is a meter showing moderate level of risk ppt powerpoint presentation model summary. This is a four stage process. The stages in this process are risk meter, risk speedometer, hazard meter.
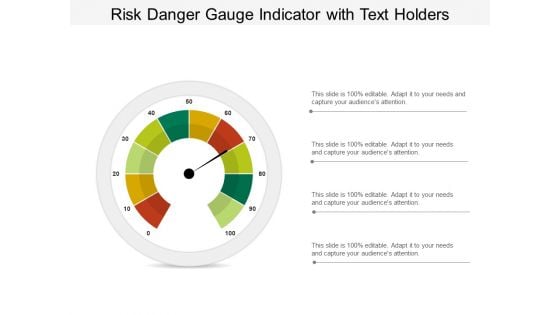
Risk Danger Gauge Indicator With Text Holders Ppt PowerPoint Presentation Outline Good
This is a risk danger gauge indicator with text holders ppt powerpoint presentation outline good. This is a four stage process. The stages in this process are risk meter, risk speedometer, hazard meter.
Risk Meter Indicating Extreme Level Ppt PowerPoint Presentation Icon Template
This is a risk meter indicating extreme level ppt powerpoint presentation icon template. This is a five stage process. The stages in this process are risk meter, risk speedometer, hazard meter.
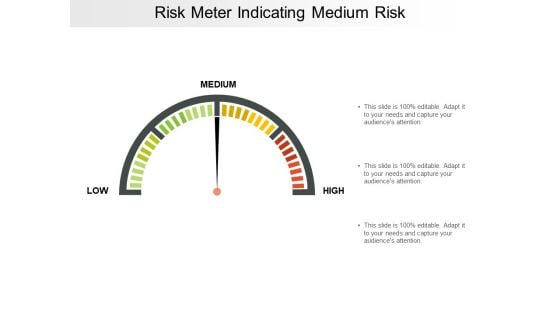
Risk Meter Indicating Medium Risk Ppt PowerPoint Presentation Ideas Graphics
This is a risk meter indicating medium risk ppt powerpoint presentation ideas graphics. This is a three stage process. The stages in this process are risk meter, risk speedometer, hazard meter.
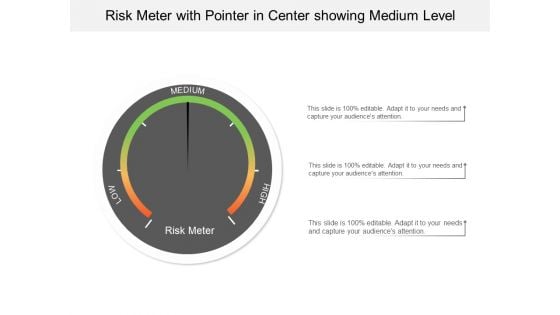
Risk Meter With Pointer In Center Showing Medium Level Ppt PowerPoint Presentation Portfolio Templates
This is a risk meter with pointer in center showing medium level ppt powerpoint presentation portfolio templates. This is a three stage process. The stages in this process are risk meter, risk speedometer, hazard meter.
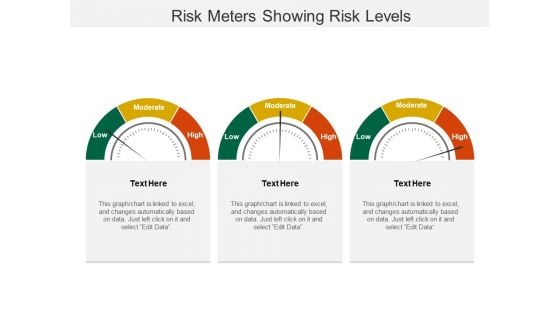
Risk Meters Showing Risk Levels Ppt PowerPoint Presentation Summary Example
This is a risk meters showing risk levels ppt powerpoint presentation summary example. This is a three stage process. The stages in this process are risk meter, risk speedometer, hazard meter.
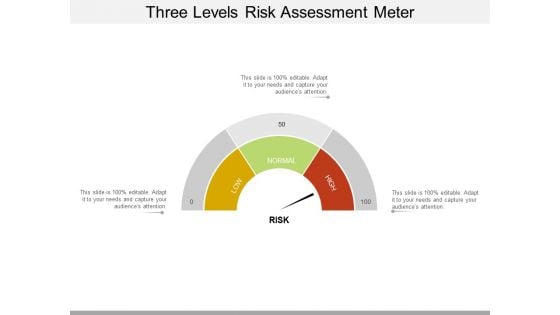
Three Levels Risk Assessment Meter Ppt PowerPoint Presentation Infographics Themes
This is a three levels risk assessment meter ppt powerpoint presentation infographics themes. This is a three stage process. The stages in this process are risk meter, risk speedometer, hazard meter.
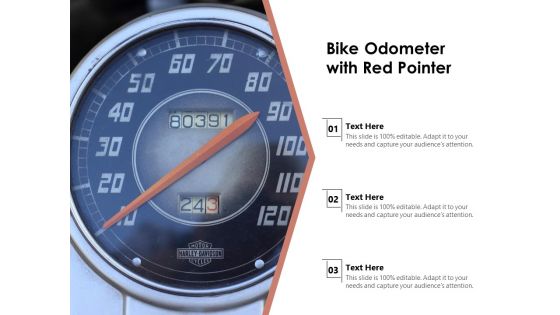
Bike Odometer With Red Pointer Ppt PowerPoint Presentation Pictures Templates PDF
Presenting bike odometer with red pointer ppt powerpoint presentation pictures templates pdf to dispense important information. This template comprises three stages. It also presents valuable insights into the topics including bike odometer with red pointer. This is a completely customizable PowerPoint theme that can be put to use immediately. So, download it and address the topic impactfully.

Odometer Image For Kilometer And Speed Control Ppt PowerPoint Presentation Ideas Deck PDF
Presenting odometer image for kilometer and speed control ppt powerpoint presentation ideas deck pdf to dispense important information. This template comprises two stages. It also presents valuable insights into the topics including odometer image for kilometer, speed control. This is a completely customizable PowerPoint theme that can be put to use immediately. So, download it and address the topic impactfully.
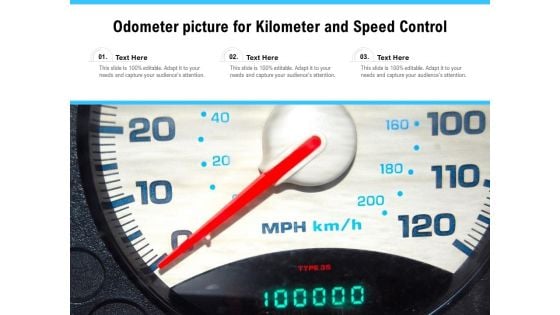
Odometer Picture For Kilometer And Speed Control Ppt PowerPoint Presentation Infographics Graphics PDF
Presenting odometer picture for kilometer and speed control ppt powerpoint presentation infographics graphics pdf to dispense important information. This template comprises three stages. It also presents valuable insights into the topics including odometer picture for kilometer and speed control. This is a completely customizable PowerPoint theme that can be put to use immediately. So, download it and address the topic impactfully.
Odometer Showing Zeros Vector Icon Ppt PowerPoint Presentation Model Graphics Template PDF
Pitch your topic with ease and precision using this odometer showing zeros vector icon ppt powerpoint presentation model graphics template pdf. This layout presents information on odometer showing zeros vector icon. It is also available for immediate download and adjustment. So, changes can be made in the color, design, graphics or any other component to create a unique layout.
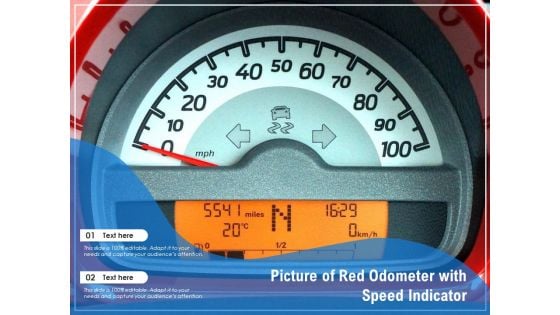
Picture Of Red Odometer With Speed Indicator Ppt PowerPoint Presentation Summary Ideas PDF
Presenting picture of red odometer with speed indicator ppt powerpoint presentation summary ideas pdf to dispense important information. This template comprises two stages. It also presents valuable insights into the topics including picture of red odometer, speed indicator. This is a completely customizable PowerPoint theme that can be put to use immediately. So, download it and address the topic impactfully.
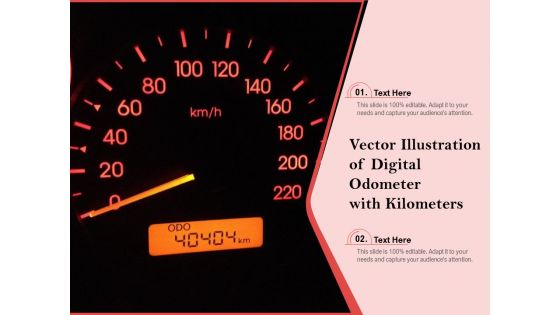
Vector Illustration Of Digital Odometer With Kilometers Ppt PowerPoint Presentation Slides Example PDF
Presenting vector illustration of digital odometer with kilometers ppt powerpoint presentation slides example pdf to dispense important information. This template comprises two stages. It also presents valuable insights into the topics including vector illustration of digital odometer with kilometer. This is a completely customizable PowerPoint theme that can be put to use immediately. So, download it and address the topic impactfully.
Odometer For Speed Control Vector Icon Ppt PowerPoint Presentation Slides Infographics PDF
Persuade your audience using this odometer for speed control vector icon ppt powerpoint presentation slides infographics pdf. This PPT design covers three stages, thus making it a great tool to use. It also caters to a variety of topics including odometer for speed control vector icon. Download this PPT design now to present a convincing pitch that not only emphasizes the topic but also showcases your presentation skills.
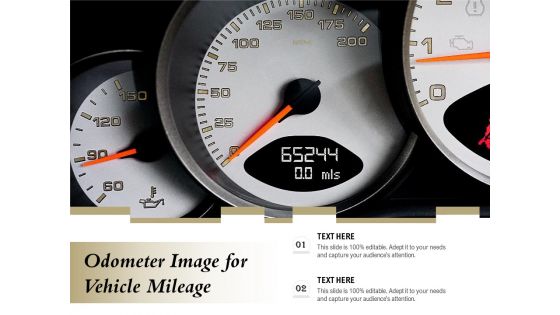
Odometer Image For Vehicle Mileage Ppt PowerPoint Presentation Ideas Guide PDF
Persuade your audience using this odometer image for vehicle mileage ppt powerpoint presentation ideas guide pdf. This PPT design covers two stages, thus making it a great tool to use. It also caters to a variety of topics including odometer image for vehicle mileage. Download this PPT design now to present a convincing pitch that not only emphasizes the topic but also showcases your presentation skills.
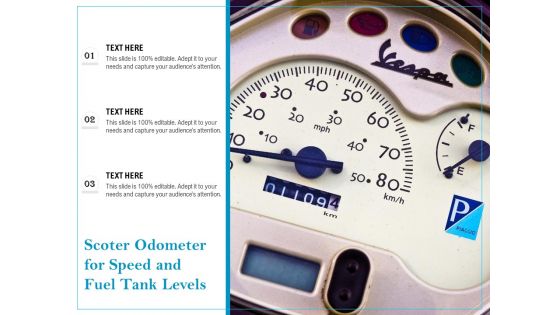
Scoter Odometer For Speed And Fuel Tank Levels Ppt PowerPoint Presentation Outline Mockup PDF
Persuade your audience using this scoter odometer for speed and fuel tank levels ppt powerpoint presentation outline mockup pdf. This PPT design covers three stages, thus making it a great tool to use. It also caters to a variety of topics including scoter odometer, speed and fuel tank levels. Download this PPT design now to present a convincing pitch that not only emphasizes the topic but also showcases your presentation skills.
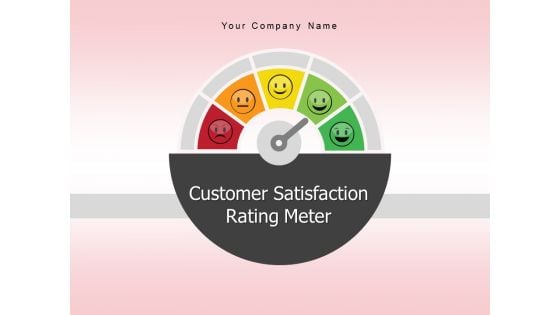
Customer Satisfaction Rating Meter Feedback Rating Scale Sale Services Excellent Ppt PowerPoint Presentation Complete Deck
Presenting this set of slides with name customer satisfaction rating meter feedback rating scale sale services excellent ppt powerpoint presentation complete deck. The topics discussed in these slides are feedback rating scale, sale services, excellent, product, services. This is a completely editable PowerPoint presentation and is available for immediate download. Download now and impress your audience.
Good Better Best Rating Meter With Icons Ppt Powerpoint Presentation Outline Vector
This is a good better best rating meter with icons ppt powerpoint presentation outline vector. This is a three stage process. The stages in this process are good better best, good great superb, good great excellent.
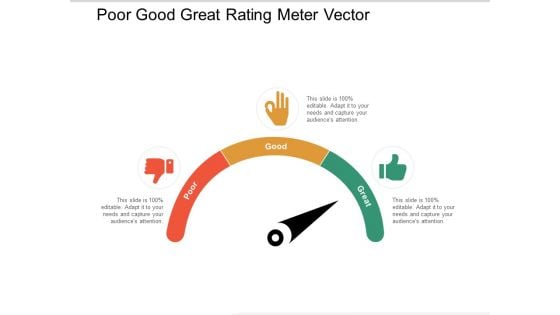
Poor Good Great Rating Meter Vector Ppt PowerPoint Presentation Show Slide Download
Presenting this set of slides with name poor good great rating meter vector ppt powerpoint presentation show slide download. This is a three stage process. The stages in this process are product quality, product improvement, rating scale. This is a completely editable PowerPoint presentation and is available for immediate download. Download now and impress your audience.
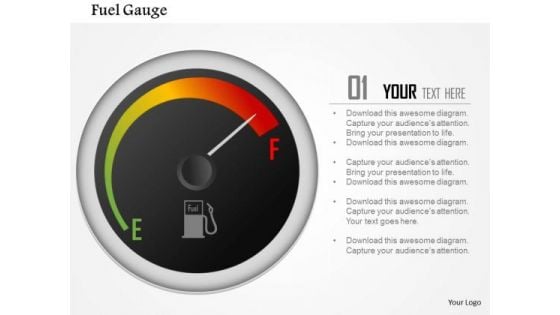
Business Framework Fuel Gauge Indicator PowerPoint Presentation
This diagram displays framework of fuel gauge indicator. It contains graphic of black meter indicating the fuel gauge. Use this editable diagram for your business and technology related presentations.
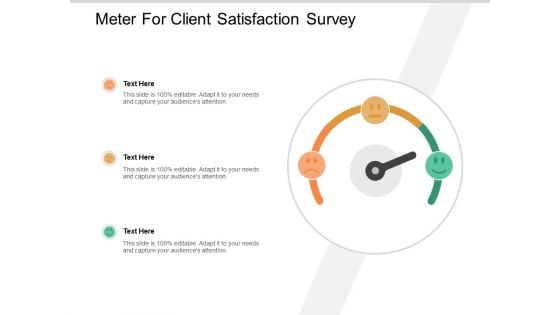
Meter For Client Satisfaction Survey Ppt PowerPoint Presentation Portfolio Outline
Presenting this set of slides with name meter for client satisfaction survey ppt powerpoint presentation portfolio outline. This is a three stage process. The stages in this process are product quality, product improvement, rating scale. This is a completely editable PowerPoint presentation and is available for immediate download. Download now and impress your audience.
Red Yellow Green Meter With Emoticons For Feedback Ppt PowerPoint Presentation Ideas Template
Presenting this set of slides with name red yellow green meter with emoticons for feedback ppt powerpoint presentation ideas template. This is a three stage process. The stages in this process are product quality, product improvement, rating scale. This is a completely editable PowerPoint presentation and is available for immediate download. Download now and impress your audience.
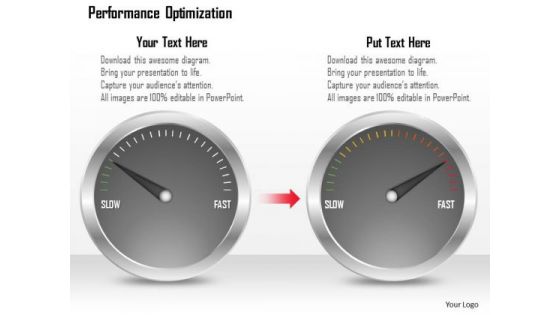
Business Framework Performance Optimization PowerPoint Presentation
Explain the concept of performance optimization with this exclusive template slide. This PPT diagram slide contains the graphic of two meters with maximum ratings. Use this PPT diagram slide and build exclusive presentation for your viewers.
Dashboard Meter On Excel Ppt PowerPoint Presentation Icon Slides PDF
Showcasing this set of slides titled dashboard meter on excel ppt powerpoint presentation icon slides pdf. The topics addressed in these templates are dashboard meter on excel. All the content presented in this PPT design is completely editable. Download it and make adjustments in color, background, font etc. as per your unique business setting.
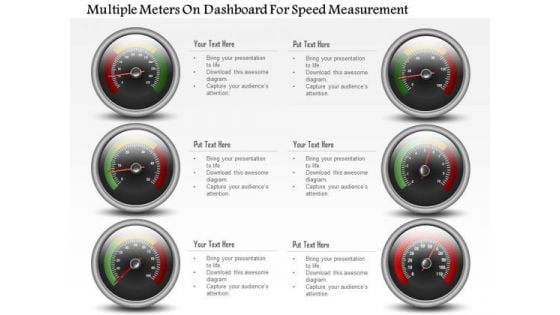
Business Diagram Multiple Meters On Dashboard For Speed Measurement PowerPoint Slide
This business diagram has been designed with multiple meters on dashboard. This slide can be used for business planning and progress. Use this diagram for your business and success milestones related presentations.

Basketball Teams Playing With Each Other At Tournament Ppt PowerPoint Presentation Visual Aids Ideas PDF
Presenting this set of slides with name customer satisfaction rating meter feedback rating scale sale services excellent ppt powerpoint presentation complete deck. The topics discussed in these slide is basketball teams playing with each other at tournament. This is a completely editable PowerPoint presentation and is available for immediate download. Download now and impress your audience.
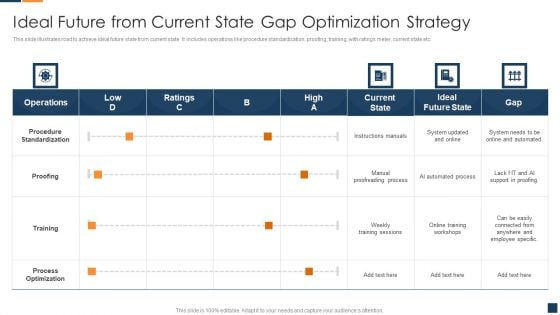
Ideal Future From Current State Gap Optimization Strategy Brochure PDF
This slide illustrates road to achieve ideal future state from current state. It includes operations like procedure standardization, proofing, training, with ratings meter, current state etc. Showcasing this set of slides titled Ideal Future From Current State Gap Optimization Strategy Brochure PDF. The topics addressed in these templates are Procedure Standardization, Process Optimization, Proofreading Process. All the content presented in this PPT design is completely editable. Download it and make adjustments in color, background, font etc. as per your unique business setting
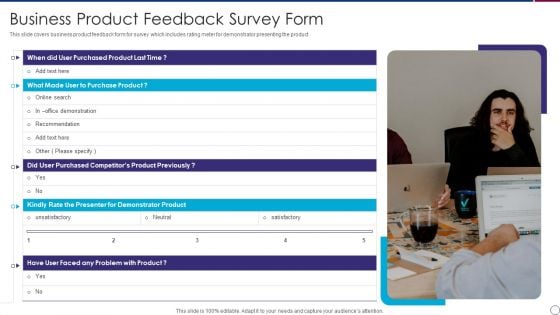
Business Product Feedback Survey Form Slides PDF
This slide covers business product feedback form for survey which includes rating meter for demonstrator presenting the product.Presenting Business Product Feedback Survey Form Slides PDF to dispense important information. This template comprises one stage. It also presents valuable insights into the topics including Purchased Product, Purchased Competitors, unsatisfactory This is a completely customizable PowerPoint theme that can be put to use immediately. So, download it and address the topic impactfully.
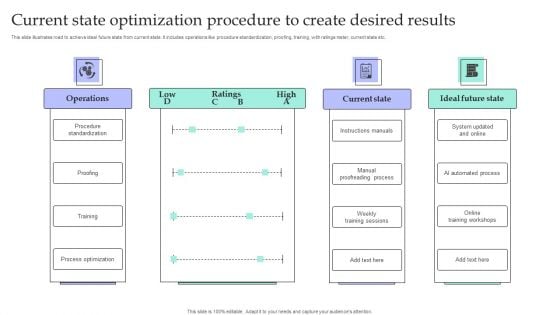
Current State Optimization Procedure To Create Desired Results Portrait PDF
This slide illustrates road to achieve ideal future state from current state. It includes operations like procedure standardization, proofing, training, with ratings meter, current state etc.Showcasing this set of slides titled Current State Optimization Procedure To Create Desired Results Portrait PDF. The topics addressed in these templates are Procedure Standardization, Proofreading Process, Process Optimization. All the content presented in this PPT design is completely editable. Download it and make adjustments in color, background, font etc. as per your unique business setting.
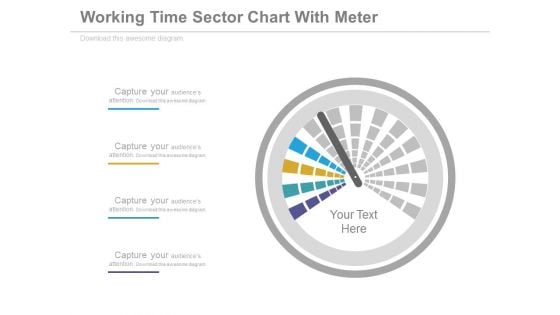
Dashboard Performance Analysis Chart Powerpoint Slides
This PowerPoint template graphics of meter chart. Download this PPT chart for business performance analysis. This PowerPoint slide is of great help in the business sector to make realistic presentations and provides effective way of presenting your newer thoughts.
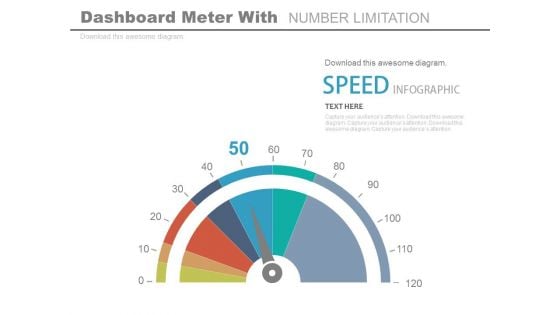
Dashboard To Impact The Performance Powerpoint Slides
This PowerPoint template graphics of meter chart. Download this PPT chart for business performance analysis. This PowerPoint slide is of great help in the business sector to make realistic presentations and provides effective way of presenting your newer thoughts.
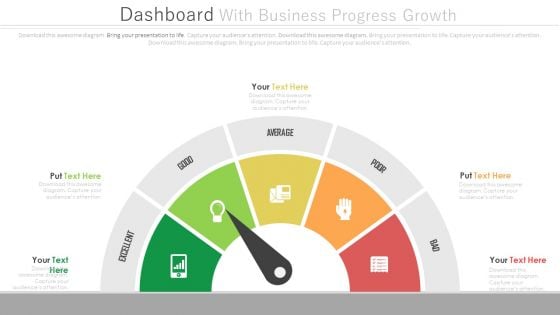
Dashboard To Simplify Business Data Analysis Powerpoint Slides
This PowerPoint template graphics of meter chart. Download this PPT chart to simplify business data analysis. This PowerPoint slide is of great help in the business sector to make realistic presentations and provides effective way of presenting your newer thoughts.
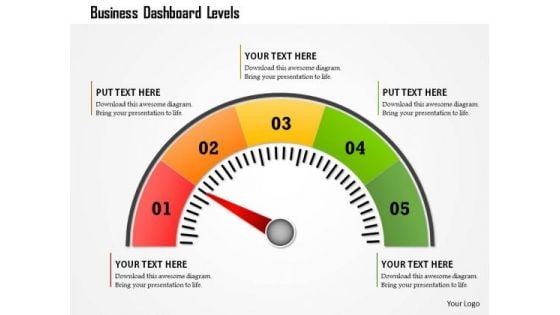
Business Framework Business Dashboard Levels PowerPoint Presentation
This business diagram displays colored meter with multiple levels. Use this diagram to display business process. This diagram can be used to indicate performance measures. This is an excellent diagram to impress your audiences.
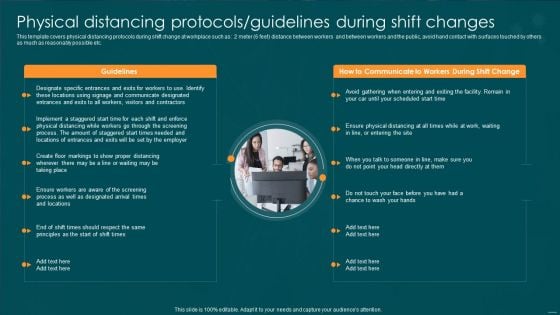
Post Pandemic Business Physical Distancing Protocols Guidelines During Shift Download PDF
This template covers physical distancing protocols during shift change at workplace such as 2 meter 6 feet distance between workers and between workers and the public, avoid hand contact with surfaces touched by others as much as reasonably possible etc. Slidegeeks has constructed Post Pandemic Business Physical Distancing Protocols Guidelines During Shift Download PDF after conducting extensive research and examination. These presentation templates are constantly being generated and modified based on user preferences and critiques from editors. Here, you will find the most attractive templates for a range of purposes while taking into account ratings and remarks from users regarding the content. This is an excellent jumping-off point to explore our content and will give new users an insight into our top-notch PowerPoint Templates.
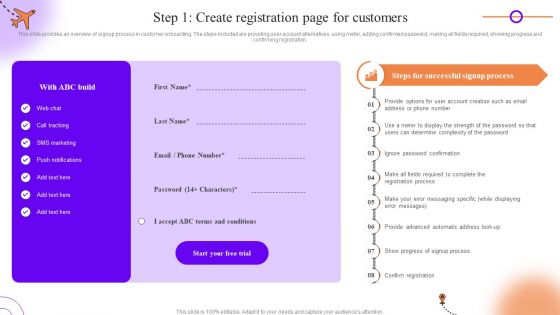
Client Onboarding Journey Impact On Business Step 1 Create Registration Page For Customers Template PDF
This slide provides an overview of signup process in customer onboarding. The steps included are providing user account alternatives, using meter, adding confirmed password, making all fields required, showing progress and confirming registration. Slidegeeks has constructed Client Onboarding Journey Impact On Business Step 1 Create Registration Page For Customers Template PDF after conducting extensive research and examination. These presentation templates are constantly being generated and modified based on user preferences and critiques from editors. Here, you will find the most attractive templates for a range of purposes while taking into account ratings and remarks from users regarding the content. This is an excellent jumping-off point to explore our content and will give new users an insight into our top-notch PowerPoint Templates.
Customer Satisfaction Levels High Medium Low Indicator Dashboard Ppt PowerPoint Presentation Icon Show
This is a customer satisfaction levels high medium low indicator dashboard ppt powerpoint presentation icon show. This is a six stage process. The stages in this process are performance dashboard, performance meter, performance kpi.
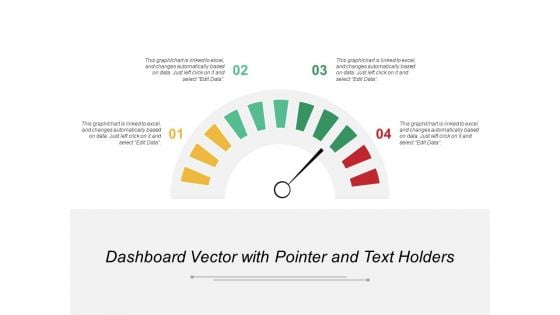
Dashboard Vector With Pointer And Text Holders Ppt PowerPoint Presentation Portfolio Format Ideas
This is a dashboard vector with pointer and text holders ppt powerpoint presentation portfolio format ideas. This is a four stage process. The stages in this process are performance dashboard, performance meter, performance kpi.
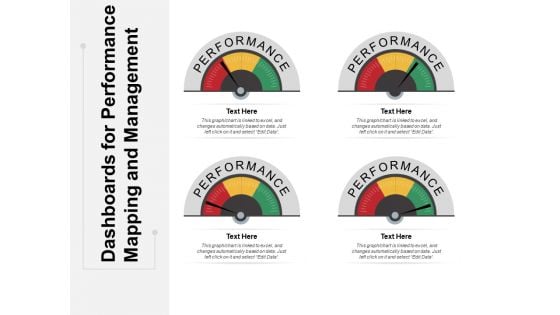
Dashboards For Performance Mapping And Management Ppt PowerPoint Presentation Ideas File Formats
This is a dashboards for performance mapping and management ppt powerpoint presentation ideas file formats. This is a four stage process. The stages in this process are performance dashboard, performance meter, performance kpi.
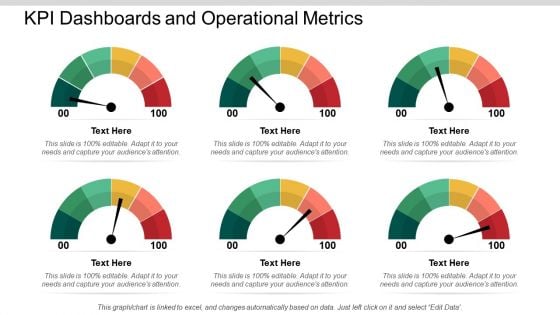
KPI Dashboards And Operational Metrics Ppt PowerPoint Presentation Portfolio Infographics

Low High Performance Measurement Indicator Dashboard Ppt PowerPoint Presentation Summary Images
This is a low high performance measurement indicator dashboard ppt powerpoint presentation summary images. This is a five stage process. The stages in this process are performance dashboard, performance meter, performance kpi.
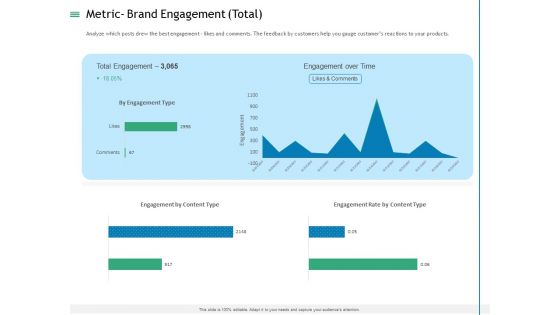
Measuring Influencer Marketing ROI Metric Brand Engagement Total Themes PDF
Analyze which posts drew the best engagement likes and comments. The feedback by customers help you gauge customers reactions to your products. Deliver an awe-inspiring pitch with this creative measuring influencer marketing roi metric brand engagement total themes pdf bundle. Topics like engagement over time, total engagement, engagement by content type can be discussed with this completely editable template. It is available for immediate download depending on the needs and requirements of the user.
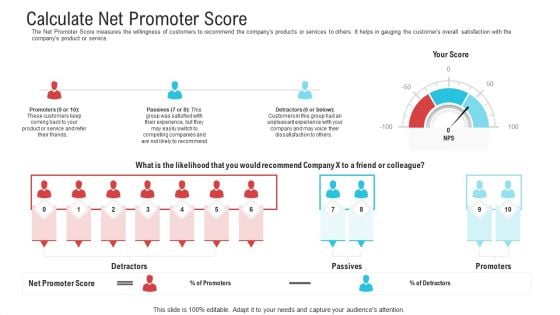
Objective To Improve Customer Experience Calculate Net Promoter Score Slides PDF
The Net Promoter Score measures the willingness of customers to recommend the companys products or services to others. It helps in gauging the customers overall satisfaction with the companys product or service.Deliver an awe-inspiring pitch with this creative objective to improve customer experience calculate net promoter score slides pdf. bundle. Topics like calculate net promoter score can be discussed with this completely editable template. It is available for immediate download depending on the needs and requirements of the user.
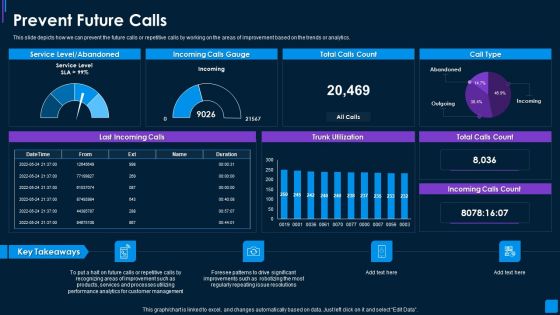
Advance IT Service Delivery Prevent Future Calls Clipart PDF
This slide depicts how we can prevent the future calls or repetitive calls by working on the areas of improvement based on the trends or analytics. Deliver and pitch your topic in the best possible manner with this advance it service delivery prevent future calls clipart pdf. Use them to share invaluable insights on service level, abandoned, incoming calls gauge, total calls count and impress your audience. This template can be altered and modified as per your expectations. So, grab it now.
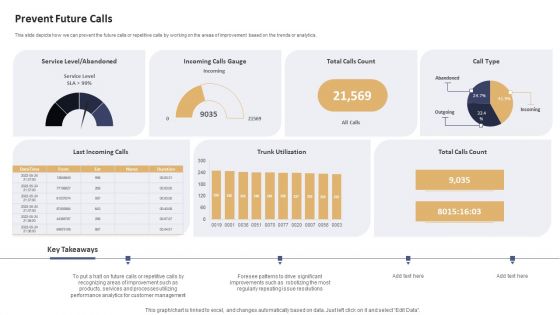
Data Processing Services Delivery Prevent Future Calls Ppt Inspiration Clipart Images PDF
This slide depicts how we can prevent the future calls or repetitive calls by working on the areas of improvement based on the trends or analytics. Deliver an awe inspiring pitch with this creative Data Processing Services Delivery Prevent Future Calls Ppt Inspiration Clipart Images PDF bundle. Topics like Service Level, Abandoned, Incoming Calls Gauge, Total Calls Count can be discussed with this completely editable template. It is available for immediate download depending on the needs and requirements of the user.
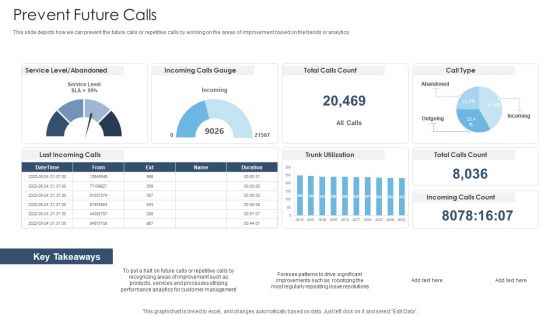
Achieving Proactive From Reactive Prevent Future Calls Structure PDF
This slide depicts how we can prevent the future calls or repetitive calls by working on the areas of improvement based on the trends or analytics. Deliver an awe inspiring pitch with this creative Achieving Proactive From Reactive Prevent Future Calls Structure PDF bundle. Topics like Service Level, Abandoned, Incoming Calls Gauge, Total Calls Count can be discussed with this completely editable template. It is available for immediate download depending on the needs and requirements of the user.

Software Application Marketing Data Analytics Report Mockup PDF
This slide shows app marketing analytics dashboard to gauge how well the marketing efforts are performing. It includes parameters like non organic content, organic content attribution,reengegement. Showcasing this set of slides titled Software Application Marketing Data Analytics Report Mockup PDF. The topics addressed in these templates are Software Application, Marketing Data, Analytics Report. All the content presented in this PPT design is completely editable. Download it and make adjustments in color, background, font etc. as per your unique business setting.

 Home
Home