Velocity
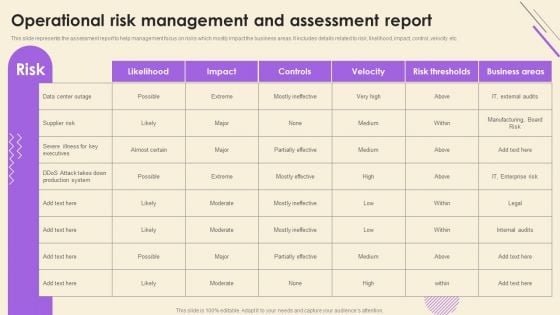
Operational Risk Assessment And Management Plan Operational Risk Management And Assessment Report Rules PDF
This slide represents the assessment report to help management focus on risks which mostly impact the business areas. It includes details related to risk, likelihood, impact, control, velocity etc. Explore a selection of the finest Operational Risk Assessment And Management Plan Operational Risk Management And Assessment Report Rules PDF here. With a plethora of professionally designed and pre-made slide templates, you can quickly and easily find the right one for your upcoming presentation. You can use our Operational Risk Assessment And Management Plan Operational Risk Management And Assessment Report Rules PDF to effectively convey your message to a wider audience. Slidegeeks has done a lot of research before preparing these presentation templates. The content can be personalized and the slides are highly editable. Grab templates today from Slidegeeks.
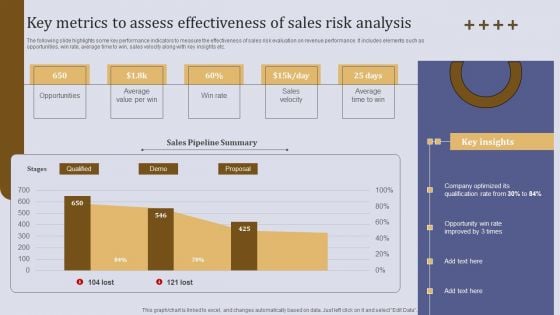
Key Metrics To Assess Effectiveness Of Sales Risk Analysis Ppt Outline Design Ideas PDF
The following slide highlights some key performance indicators to measure the effectiveness of sales risk evaluation on revenue performance. It includes elements such as opportunities, win rate, average time to win, sales velocity along with key insights etc. Retrieve professionally designed Key Metrics To Assess Effectiveness Of Sales Risk Analysis Ppt Outline Design Ideas PDF to effectively convey your message and captivate your listeners. Save time by selecting pre made slideshows that are appropriate for various topics, from business to educational purposes. These themes come in many different styles, from creative to corporate, and all of them are easily adjustable and can be edited quickly. Access them as PowerPoint templates or as Google Slides themes. You do not have to go on a hunt for the perfect presentation because Slidegeeks got you covered from everywhere.
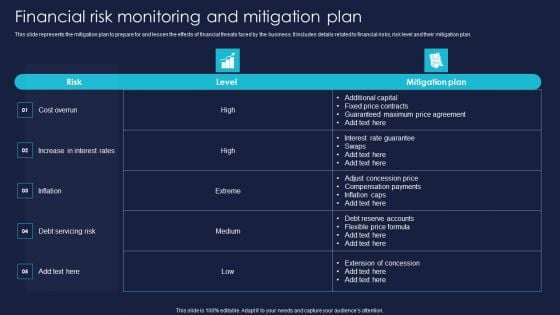
Enterprise Risk Management And Mitigation Program Financial Risk Monitoring And Mitigation Plan Formats PDF
This slide shows the plan to evaluate potential hazards, removal of hazards by adding control measures as necessary. It includes details related to risk, likelihood, impact, controls, velocity etc. Formulating a presentation can take up a lot of effort and time, so the content and message should always be the primary focus. The visuals of the PowerPoint can enhance the presenters message, so our Enterprise Risk Management And Mitigation Program Financial Risk Monitoring And Mitigation Plan Formats PDF was created to help save time. Instead of worrying about the design, the presenter can concentrate on the message while our designers work on creating the ideal templates for whatever situation is needed. Slidegeeks has experts for everything from amazing designs to valuable content, we have put everything into Enterprise Risk Management And Mitigation Program Financial Risk Monitoring And Mitigation Plan Formats PDF.
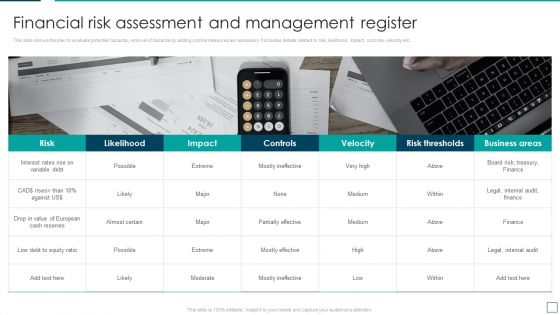
Strategic Risk Management And Mitigation Plan Financial Risk Assessment And Management Register Portrait PDF
This slide shows the plan to evaluate potential hazards, removal of hazards by adding control measures as necessary. It includes details related to risk, likelihood, impact, controls, velocity etc. Slidegeeks is one of the best resources for PowerPoint templates. You can download easily and regulate Strategic Risk Management And Mitigation Plan Financial Risk Assessment And Management Register Portrait PDF for your personal presentations from our wonderful collection. A few clicks is all it takes to discover and get the most relevant and appropriate templates. Use our Templates to add a unique zing and appeal to your presentation and meetings. All the slides are easy to edit and you can use them even for advertisement purposes.
Strategic Risk Management And Mitigation Plan Operational Risk Management And Assessment Report Inspiration PDF
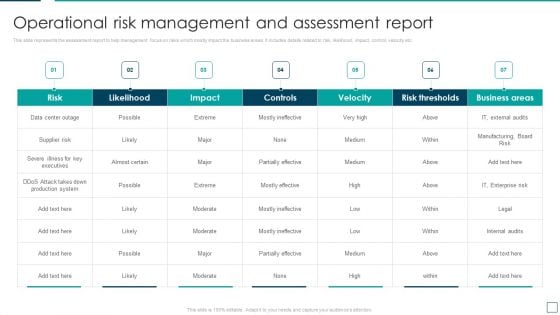
This slide represents the assessment report to help management focus on risks which mostly impact the business areas. It includes details related to risk, likelihood, impact, control, velocity etc. This Strategic Risk Management And Mitigation Plan Operational Risk Management And Assessment Report Inspiration PDF is perfect for any presentation, be it in front of clients or colleagues. It is a versatile and stylish solution for organizing your meetings. The Strategic Risk Management And Mitigation Plan Operational Risk Management And Assessment Report Inspiration PDF features a modern design for your presentation meetings. The adjustable and customizable slides provide unlimited possibilities for acing up your presentation. Slidegeeks has done all the homework before launching the product for you. So, do not wait, grab the presentation templates today.
Streamlining Operations With Supply Chain Automation Selection Criteria For Goods To Person Solution Sample PDF
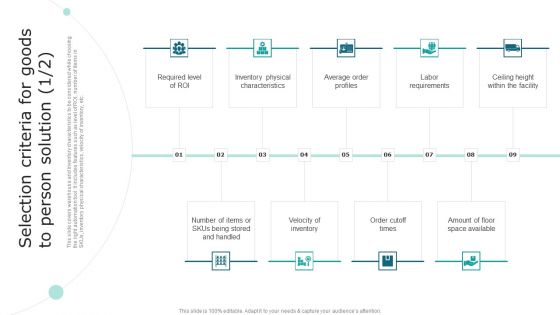
This slide covers warehouse and inventory characteristics to be considered while choosing the right automation tool. It includes features such as level of ROI, number of items in SKUs, inventory physical characteristics, velocity of inventory, etc. Slidegeeks is here to make your presentations a breeze with Streamlining Operations With Supply Chain Automation Selection Criteria For Goods To Person Solution Sample PDF With our easy to use and customizable templates, you can focus on delivering your ideas rather than worrying about formatting. With a variety of designs to choose from, you are sure to find one that suits your needs. And with animations and unique photos, illustrations, and fonts, you can make your presentation pop. So whether you are giving a sales pitch or presenting to the board, make sure to check out Slidegeeks first.
Sales Risk Assessment For Profit Maximization Defining Key Metrics To Analyse Current Sales Performance Pictures PDF
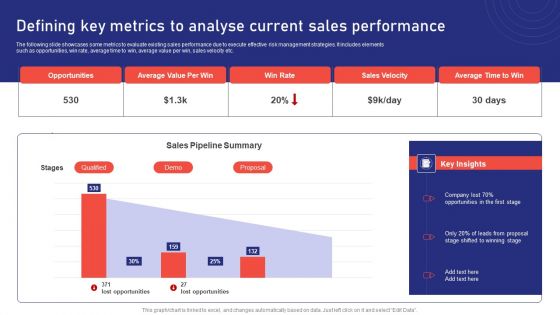
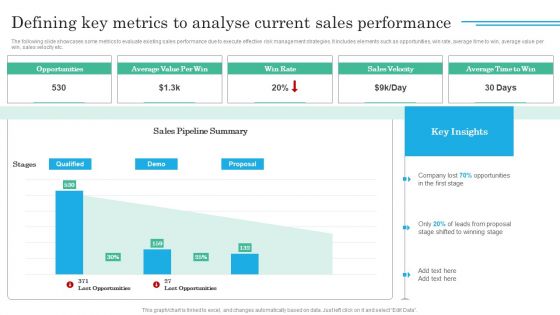
The following slide showcases some metrics to evaluate existing sales performance due to execute effective risk management strategies. It includes elements such as opportunities, win rate, average time to win, average value per win, sales velocity etc. Want to ace your presentation in front of a live audience Our Sales Risk Assessment For Profit Maximization Defining Key Metrics To Analyse Current Sales Performance Pictures PDF can help you do that by engaging all the users towards you. Slidegeeks experts have put their efforts and expertise into creating these impeccable powerpoint presentations so that you can communicate your ideas clearly. Moreover, all the templates are customizable, and easy to edit and downloadable. Use these for both personal and commercial use.
Sales Risk Assessment For Profit Maximization Key Metrics To Assess Effectiveness Of Sales Risk Analysis Ideas PDF
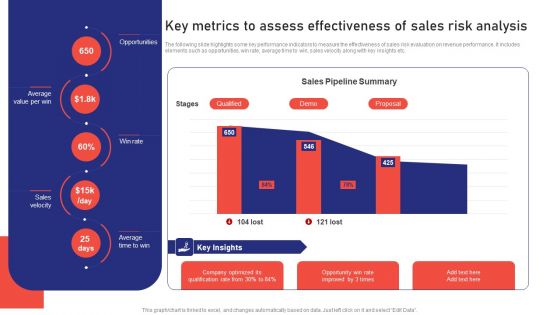
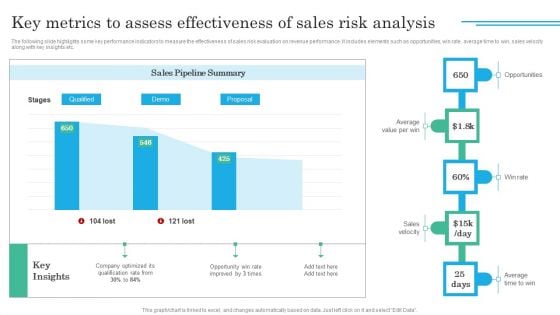
The following slide highlights some key performance indicators to measure the effectiveness of sales risk evaluation on revenue performance. It includes elements such as opportunities, win rate, average time to win, sales velocity along with key insights etc. Get a simple yet stunning designed Sales Risk Assessment For Profit Maximization Key Metrics To Assess Effectiveness Of Sales Risk Analysis Ideas PDF. It is the best one to establish the tone in your meetings. It is an excellent way to make your presentations highly effective. So, download this PPT today from Slidegeeks and see the positive impacts. Our easy to edit Sales Risk Assessment For Profit Maximization Key Metrics To Assess Effectiveness Of Sales Risk Analysis Ideas PDF can be your go to option for all upcoming conferences and meetings. So, what are you waiting for Grab this template today.
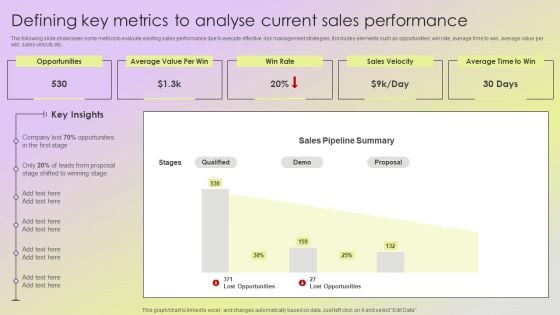
Mitigating Sales Risks With Strategic Action Planning Defining Key Metrics To Analyse Current Sales Performance Slides PDF
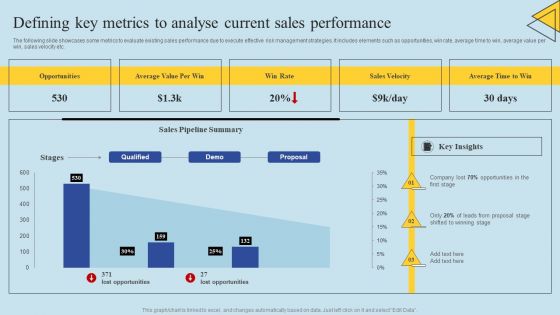
The following slide showcases some metrics to evaluate existing sales performance due to execute effective risk management strategies. It includes elements such as opportunities, win rate, average time to win, average value per win, sales velocity etc. This modern and well arranged Mitigating Sales Risks With Strategic Action Planning Defining Key Metrics To Analyse Current Sales Performance Slides PDF provides lots of creative possibilities. It is very simple to customize and edit with the Powerpoint Software. Just drag and drop your pictures into the shapes. All facets of this template can be edited with Powerpoint no extra software is necessary. Add your own material, put your images in the places assigned for them, adjust the colors, and then you can show your slides to the world, with an animated slide included.
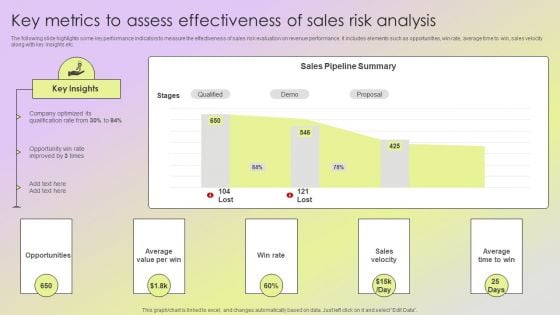
Mitigating Sales Risks With Strategic Action Planning Key Metrics To Assess Effectiveness Of Sales Risk Analysis Rules PDF
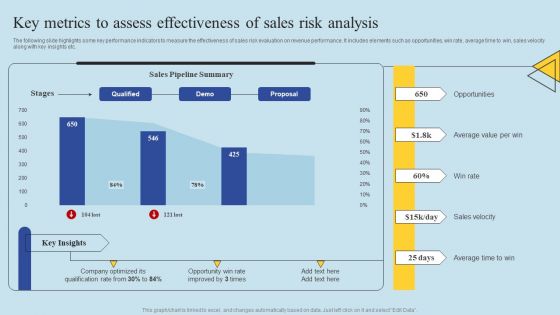
The following slide highlights some key performance indicators to measure the effectiveness of sales risk evaluation on revenue performance. It includes elements such as opportunities, win rate, average time to win, sales velocity along with key insights etc. Create an editable Mitigating Sales Risks With Strategic Action Planning Key Metrics To Assess Effectiveness Of Sales Risk Analysis Rules PDF that communicates your idea and engages your audience. Whether youre presenting a business or an educational presentation, pre designed presentation templates help save time. Mitigating Sales Risks With Strategic Action Planning Key Metrics To Assess Effectiveness Of Sales Risk Analysis Rules PDF is highly customizable and very easy to edit, covering many different styles from creative to business presentations. Slidegeeks has creative team members who have crafted amazing templates. So, go and get them without any delay.
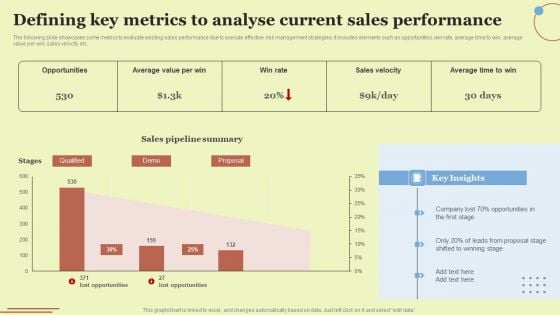
Defining Key Metrics To Analyse Current Sales Performance Rules PDF
The following slide showcases some metrics to evaluate existing sales performance due to execute effective risk management strategies. It includes elements such as opportunities, win rate, average time to win, average value per win, sales velocity etc. Do you know about Slidesgeeks Defining Key Metrics To Analyse Current Sales Performance Rules PDF These are perfect for delivering any kind od presentation. Using it, create PowerPoint presentations that communicate your ideas and engage audiences. Save time and effort by using our pre designed presentation templates that are perfect for a wide range of topic. Our vast selection of designs covers a range of styles, from creative to business, and are all highly customizable and easy to edit. Download as a PowerPoint template or use them as Google Slides themes.
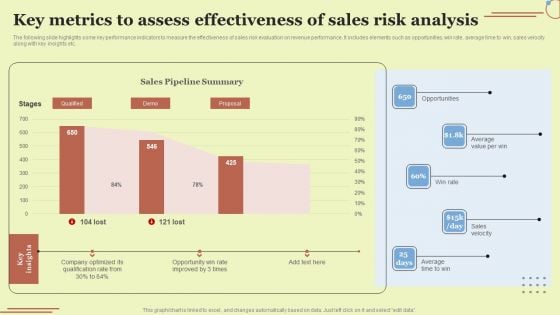
Key Metrics To Assess Effectiveness Of Sales Risk Analysis Download PDF
The following slide highlights some key performance indicators to measure the effectiveness of sales risk evaluation on revenue performance. It includes elements such as opportunities, win rate, average time to win, sales velocity along with key insights etc. Get a simple yet stunning designed Key Metrics To Assess Effectiveness Of Sales Risk Analysis Download PDF. It is the best one to establish the tone in your meetings. It is an excellent way to make your presentations highly effective. So, download this PPT today from Slidegeeks and see the positive impacts. Our easy to edit Key Metrics To Assess Effectiveness Of Sales Risk Analysis Download PDF can be your go to option for all upcoming conferences and meetings. So, what are you waiting for Grab this template today.
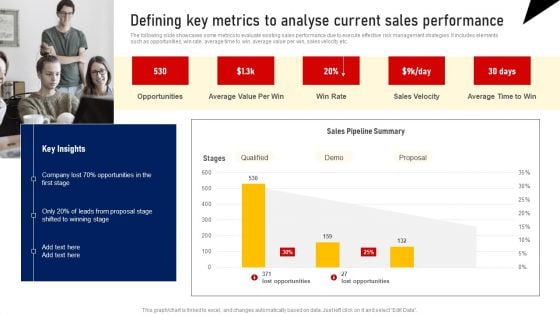
Defining Key Metrics To Analyse Current Sales Performance Summary PDF
The following slide showcases some metrics to evaluate existing sales performance due to execute effective risk management strategies. It includes elements such as opportunities, win rate, average time to win, average value per win, sales velocity etc. Do you know about Slidesgeeks Defining Key Metrics To Analyse Current Sales Performance Summary PDF These are perfect for delivering any kind od presentation. Using it, create PowerPoint presentations that communicate your ideas and engage audiences. Save time and effort by using our pre designed presentation templates that are perfect for a wide range of topic. Our vast selection of designs covers a range of styles, from creative to business, and are all highly customizable and easy to edit. Download as a PowerPoint template or use them as Google Slides themes.
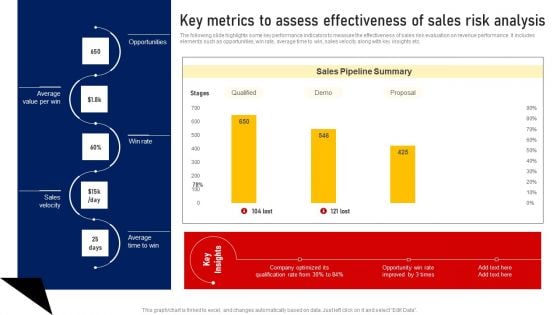
Performing Sales Risk Analysis Procedure Key Metrics To Assess Effectiveness Of Sales Risk Analysis Brochure PDF
The following slide highlights some key performance indicators to measure the effectiveness of sales risk evaluation on revenue performance. It includes elements such as opportunities, win rate, average time to win, sales velocity along with key insights etc. Get a simple yet stunning designed Performing Sales Risk Analysis Procedure Key Metrics To Assess Effectiveness Of Sales Risk Analysis Brochure PDF. It is the best one to establish the tone in your meetings. It is an excellent way to make your presentations highly effective. So, download this PPT today from Slidegeeks and see the positive impacts. Our easy to edit Performing Sales Risk Analysis Procedure Key Metrics To Assess Effectiveness Of Sales Risk Analysis Brochure PDF can be your go to option for all upcoming conferences and meetings. So, what are you waiting for Grab this template today.

Key Metrics To Assess Effectiveness Of Sales Risk Analysis Topics PDF
The following slide highlights some key performance indicators to measure the effectiveness of sales risk evaluation on revenue performance. It includes elements such as opportunities, win rate, average time to win, sales velocity along with key insights etc. Whether you have daily or monthly meetings, a brilliant presentation is necessary. Key Metrics To Assess Effectiveness Of Sales Risk Analysis Topics PDF can be your best option for delivering a presentation. Represent everything in detail using Key Metrics To Assess Effectiveness Of Sales Risk Analysis Topics PDF and make yourself stand out in meetings. The template is versatile and follows a structure that will cater to your requirements. All the templates prepared by Slidegeeks are easy to download and edit. Our research experts have taken care of the corporate themes as well. So, give it a try and see the results.
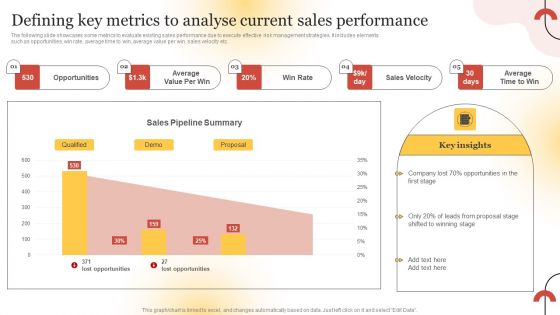
Executing Sales Risk Reduction Plan Defining Key Metrics To Analyse Current Sales Performance Diagrams PDF
The following slide showcases some metrics to evaluate existing sales performance due to execute effective risk management strategies. It includes elements such as opportunities, win rate, average time to win, average value per win, sales velocity etc. Do you know about Slidesgeeks Executing Sales Risk Reduction Plan Defining Key Metrics To Analyse Current Sales Performance Diagrams PDF These are perfect for delivering any kind od presentation. Using it, create PowerPoint presentations that communicate your ideas and engage audiences. Save time and effort by using our pre designed presentation templates that are perfect for a wide range of topic. Our vast selection of designs covers a range of styles, from creative to business, and are all highly customizable and easy to edit. Download as a PowerPoint template or use them as Google Slides themes.
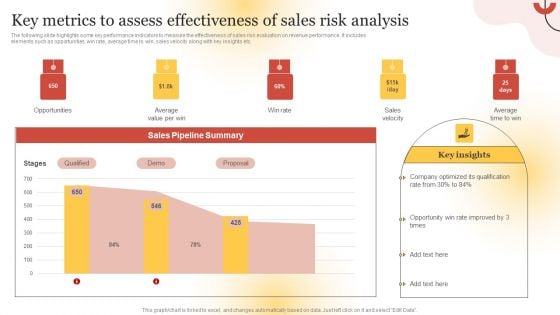
Executing Sales Risk Reduction Plan Key Metrics To Assess Effectiveness Of Sales Risk Analysis Background PDF
The following slide highlights some key performance indicators to measure the effectiveness of sales risk evaluation on revenue performance. It includes elements such as opportunities, win rate, average time to win, sales velocity along with key insights etc. Get a simple yet stunning designed Executing Sales Risk Reduction Plan Key Metrics To Assess Effectiveness Of Sales Risk Analysis Background PDF. It is the best one to establish the tone in your meetings. It is an excellent way to make your presentations highly effective. So, download this PPT today from Slidegeeks and see the positive impacts. Our easy to edit Executing Sales Risk Reduction Plan Key Metrics To Assess Effectiveness Of Sales Risk Analysis Background PDF can be your go to option for all upcoming conferences and meetings. So, what are you waiting for Grab this template today.
Implementing Sales Volatility Management Techniques Defining Key Metrics To Analyse Current Sales Ideas PDF
The following slide showcases some metrics to evaluate existing sales performance due to execute effective risk management strategies. It includes elements such as opportunities, win rate, average time to win, average value per win, sales velocity etc. Want to ace your presentation in front of a live audience Our Implementing Sales Volatility Management Techniques Defining Key Metrics To Analyse Current Sales Ideas PDF can help you do that by engaging all the users towards you. Slidegeeks experts have put their efforts and expertise into creating these impeccable powerpoint presentations so that you can communicate your ideas clearly. Moreover, all the templates are customizable, and easy to edit and downloadable. Use these for both personal and commercial use.
Implementing Sales Volatility Management Techniques Key Metrics To Assess Effectiveness Of Sales Designs PDF
The following slide highlights some key performance indicators to measure the effectiveness of sales risk evaluation on revenue performance. It includes elements such as opportunities, win rate, average time to win, sales velocity along with key insights etc. Do you have an important presentation coming up Are you looking for something that will make your presentation stand out from the rest Look no further than Implementing Sales Volatility Management Techniques Key Metrics To Assess Effectiveness Of Sales Designs PDF. With our professional designs, you can trust that your presentation will pop and make delivering it a smooth process. And with Slidegeeks, you can trust that your presentation will be unique and memorable. So why wait Grab Implementing Sales Volatility Management Techniques Key Metrics To Assess Effectiveness Of Sales Designs PDF today and make your presentation stand out from the rest.
Determining Risks In Sales Administration Procedure Defining Key Metrics To Analyse Current Structure PDF
The following slide showcases some metrics to evaluate existing sales performance due to execute effective risk management strategies. It includes elements such as opportunities, win rate, average time to win, average value per win, sales velocity etc. Coming up with a presentation necessitates that the majority of the effort goes into the content and the message you intend to convey. The visuals of a PowerPoint presentation can only be effective if it supplements and supports the story that is being told. Keeping this in mind our experts created Determining Risks In Sales Administration Procedure Defining Key Metrics To Analyse Current Structure PDF to reduce the time that goes into designing the presentation. This way, you can concentrate on the message while our designers take care of providing you with the right template for the situation.
Determining Risks In Sales Administration Procedure Key Metrics To Assess Effectiveness Of Sales Pictures PDF
The following slide highlights some key performance indicators to measure the effectiveness of sales risk evaluation on revenue performance. It includes elements such as opportunities, win rate, average time to win, sales velocity along with key insights etc. This Determining Risks In Sales Administration Procedure Key Metrics To Assess Effectiveness Of Sales Pictures PDF from Slidegeeks makes it easy to present information on your topic with precision. It provides customization options, so you can make changes to the colors, design, graphics, or any other component to create a unique layout. It is also available for immediate download, so you can begin using it right away. Slidegeeks has done good research to ensure that you have everything you need to make your presentation stand out. Make a name out there for a brilliant performance.
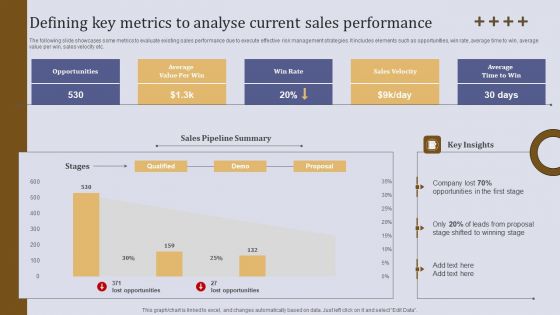
Defining Key Metrics To Analyse Current Sales Performance Ppt Infographics Ideas PDF
The following slide showcases some metrics to evaluate existing sales performance due to execute effective risk management strategies. It includes elements such as opportunities, win rate, average time to win, average value per win, sales velocity etc. Welcome to our selection of the Defining Key Metrics To Analyse Current Sales Performance Ppt Infographics Ideas PDF. These are designed to help you showcase your creativity and bring your sphere to life. Planning and Innovation are essential for any business that is just starting out. This collection contains the designs that you need for your everyday presentations. All of our PowerPoints are 100 percent editable, so you can customize them to suit your needs. This multi purpose template can be used in various situations. Grab these presentation templates today.
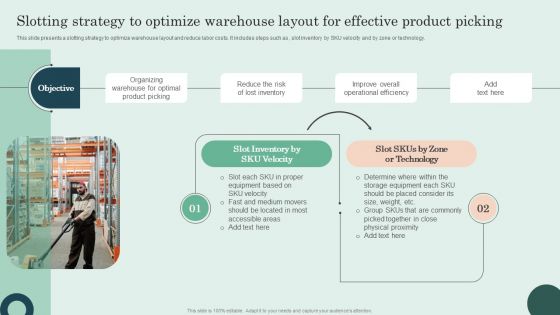
Slotting Strategy To Optimize Warehouse Layout For Effective Product Picking Graphics PDF
This slide presents a slotting strategy to optimize warehouse layout and reduce labor costs. It includes steps such as , slot inventory by SKU velocity and by zone or technology. Formulating a presentation can take up a lot of effort and time, so the content and message should always be the primary focus. The visuals of the PowerPoint can enhance the presenters message, so our Slotting Strategy To Optimize Warehouse Layout For Effective Product Picking Graphics PDF was created to help save time. Instead of worrying about the design, the presenter can concentrate on the message while our designers work on creating the ideal templates for whatever situation is needed. Slidegeeks has experts for everything from amazing designs to valuable content, we have put everything into Slotting Strategy To Optimize Warehouse Layout For Effective Product Picking Graphics PDF.
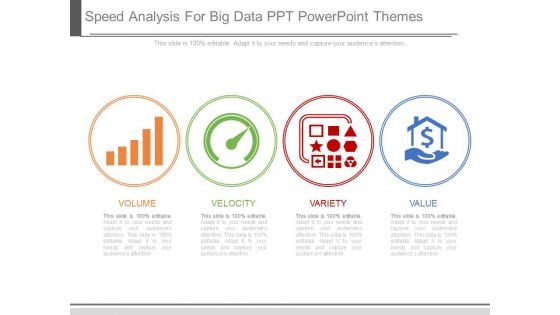
Speed Analysis For Big Data Ppt Powerpoint Themes
This is a speed analysis for big data ppt powerpoint themes. This is a four stage process. The stages in this process are volume, velocity, variety, value.
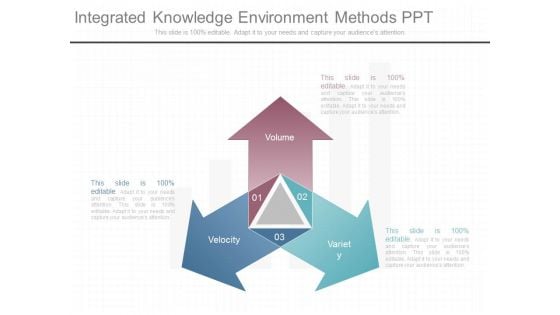
Integrated Knowledge Environment Methods Ppt
This is a integrated knowledge environment methods ppt. This is a three stage process. The stages in this process are volume, velocity, variety.
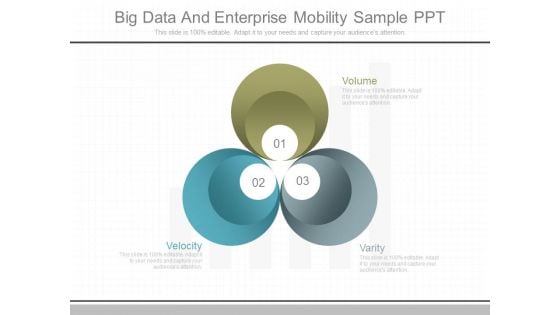
Big Data And Enterprise Mobility Sample Ppt
This is a big data and enterprise mobility sample ppt. This is a three stage process. The stages in this process are volume, velocity, varity.
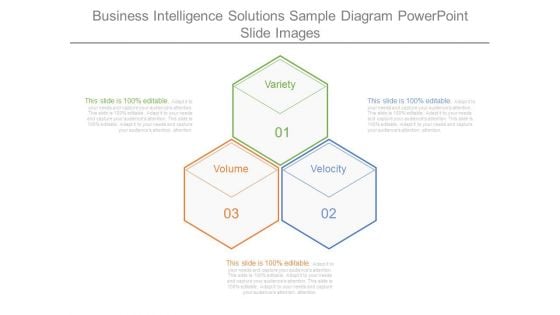
Business Intelligence Solutions Sample Diagram Powerpoint Slide Images
This is a business intelligence solutions sample diagram powerpoint slide images. This is a three stage process. The stages in this process are variety, volume, velocity.
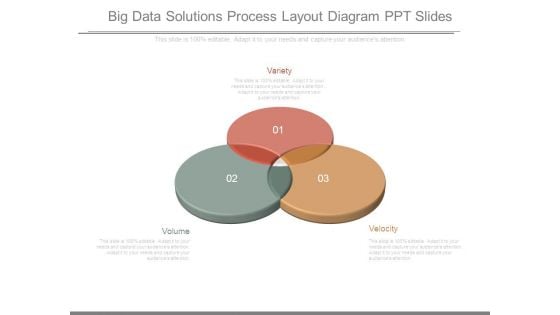
Big Data Solutions Process Layout Diagram Ppt Slides
This is a big data solutions process layout diagram ppt slides. This is a three stage process. The stages in this process are variety, velocity, volume.
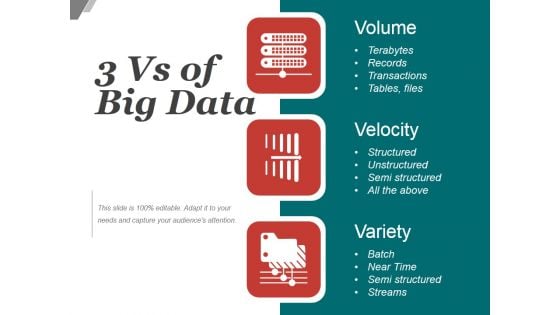
3 Vs Of Big Data Ppt PowerPoint Presentation Themes
This is a 3 vs of big data ppt powerpoint presentation themes. This is a three stage process. The stages in this process are volume, velocity, variety.
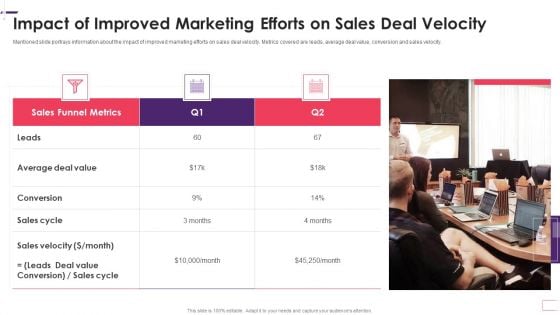
Enhancing Stp Strategies For A Successful Market Promotion Impact Of Improved Marketing Professional PDF
Mentioned slide portrays information about the impact of improved marketing efforts on sales deal velocity. Metrics covered are leads, average deal value, conversion and sales velocity. This is a enhancing stp strategies for a successful market promotion impact of improved marketing professional pdf template with various stages. Focus and dispense information on three stages using this creative set, that comes with editable features. It contains large content boxes to add your information on topics like average, value, sales cycle, sales velocity. You can also showcase facts, figures, and other relevant content using this PPT layout. Grab it now.
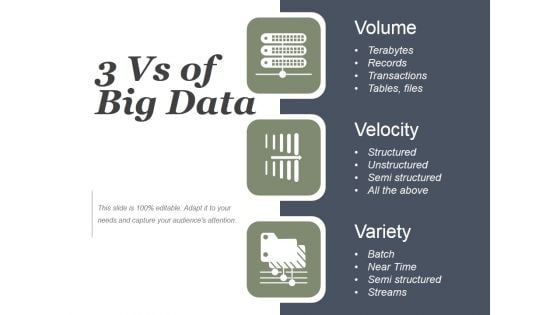
Quantity Nature Speed Of Big Data Ppt PowerPoint Presentation Model
This is a quantity nature speed of big data ppt powerpoint presentation model. This is a three stage process. The stages in this process are volume, velocity, variety, terabytes, structured, batch.
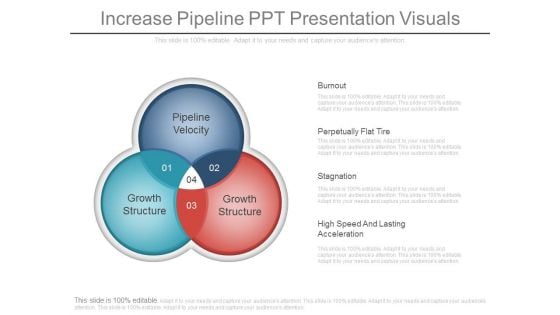
Increase Pipeline Ppt Presentation Visuals
This is a increase pipeline ppt presentation visuals. This is a four stage process. The stages in this process are burnout, perpetually flat tire, stagnation, high speed and lasting acceleration, pipeline velocity, growth structure.

Strategic Alignment And Business Contribution Diagram Summary
This is a strategic alignment and business contribution diagram summary. This is a eight stage process. The stages in this process are strategic alignment, business contribution, risk impact, complexity, business value, likelihood of success, direction, velocity, uncertainty, do ability.
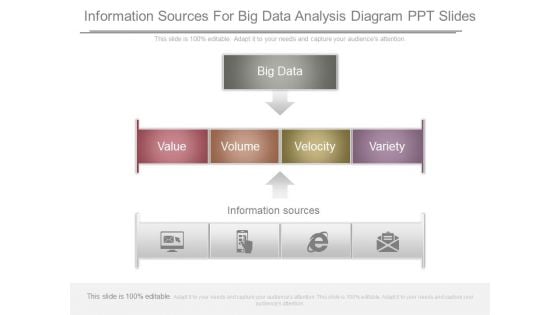
Information Sources For Big Data Analysis Diagram Ppt Slides
This is a information sources for big data analysis diagram ppt slides. This is a three stage process. The stages in this process are big data, value, volume, velocity, variety, information sources.
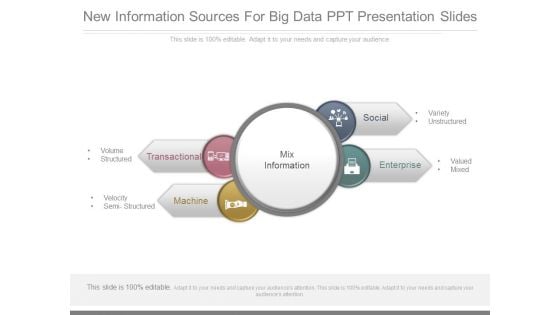
New Information Sources For Big Data Ppt Presentation Slides
This is a new information sources for big data ppt presentation slides. This is a four stage process. The stages in this process are mix information, transactional, machine, social, enterprise, volume, structured, velocity, semi structured, variety, unstructured, valued, mixed.
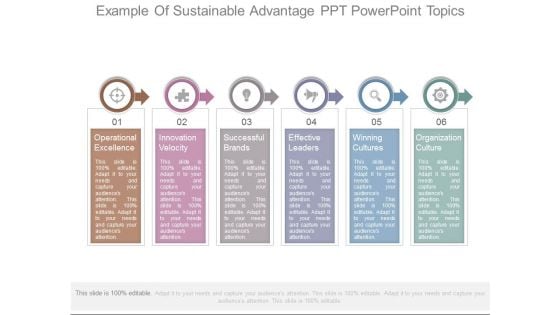
Example Of Sustainable Advantage Ppt Powerpoint Topics
This is a example of sustainable advantage ppt powerpoint topics. This is a six stage process. The stages in this process are operational excellence, innovation velocity, successful brands, effective leaders, winning cultures, organization culture.
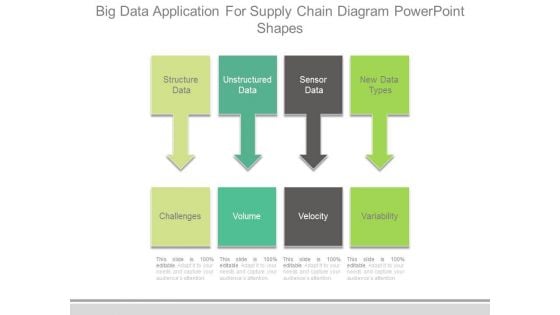
Big Data Application For Supply Chain Diagram Powerpoint Shapes
This is a big data application for supply chain diagram powerpoint shapes. This is a eight stage process. The stages in this process are structure data, unstructured data, sensor data, new data types, challenges, volume, velocity, variability.
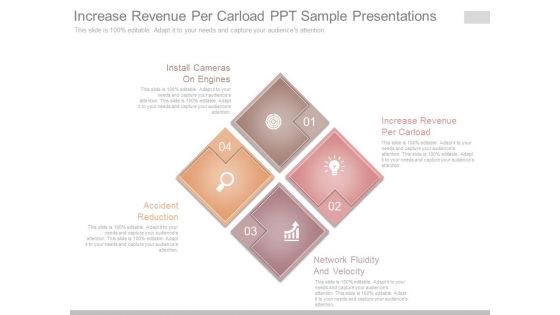
Increase Revenue Per Carload Ppt Sample Presentations
This is a increase revenue per carload ppt sample presentations. This is a four stage process. The stages in this process are install cameras on engines, accident reduction, network fluidity and velocity, increase revenue per carload.
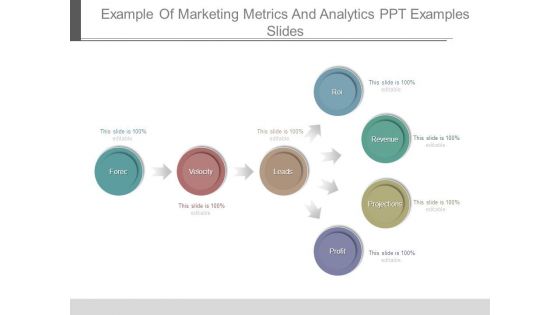
Example Of Marketing Metrics And Analytics Ppt Examples Slides
This is a example of marketing metrics and analytics ppt examples slides. This is a seven stage process. The stages in this process are forec, velocity, leads, roi, revenue, projections, profit.
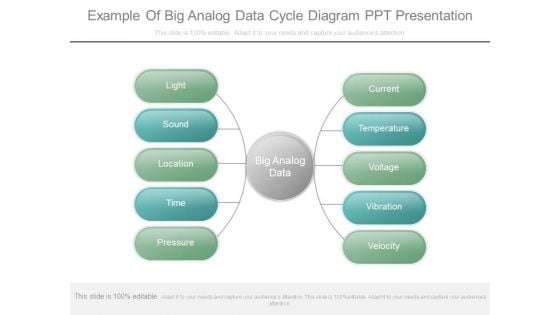
Example Of Big Analog Data Cycle Diagram Ppt Presentation
This is a example of big analog data cycle diagram ppt presentation. This is a ten stage process. The stages in this process are light, sound, location, time, pressure, big analog data, current, temperature, voltage, vibration, velocity.
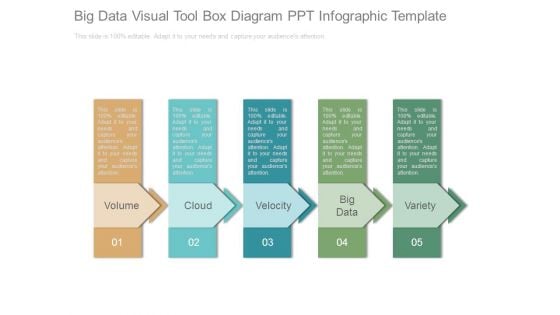
Big Data Visual Tool Box Diagram Ppt Infographic Template
This is a big data visual tool box diagram ppt infographic template. This is a five stage process. The stages in this process are volume, cloud, velocity, big data, variety.
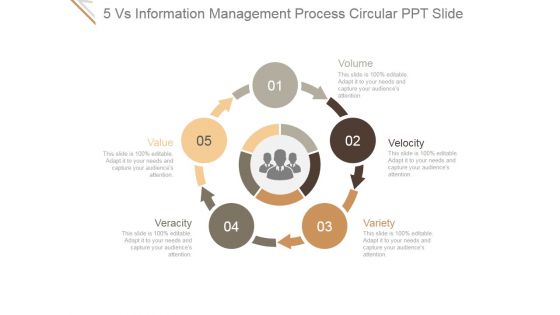
5 Vs Information Management Process Circular Ppt PowerPoint Presentation Slides
This is a 5 vs information management process circular ppt powerpoint presentation slides. This is a five stage process. The stages in this process are volume, velocity, variety, veracity, value.
5 Vs Large Data Sets Applications Circular Icons Ppt PowerPoint Presentation Picture
This is a 5 vs large data sets applications circular icons ppt powerpoint presentation picture. This is a five stage process. The stages in this process are big data, volume, velocity, variety, veracity, value.
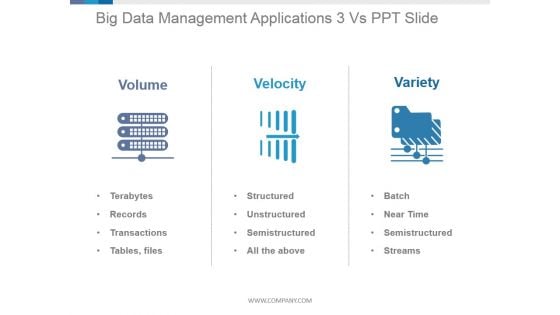
Big Data Management Applications 3 Vs Ppt PowerPoint Presentation Deck
This is a big data management applications 3 vs ppt powerpoint presentation deck. This is a three stage process. The stages in this process are volume, velocity, variety, terabytes, structured, batch.
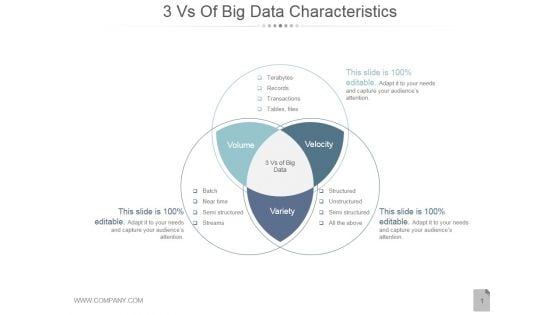
3 Vs Of Big Data Characteristics Ppt PowerPoint Presentation Example File
This is a 3 vs of big data characteristics ppt powerpoint presentation example file. This is a three stage process. The stages in this process are volume, velocity, variety.
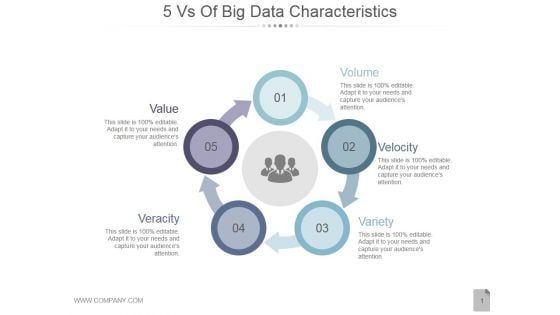
5 Vs Of Big Data Characteristics Ppt PowerPoint Presentation Model
This is a 5 vs of big data characteristics ppt powerpoint presentation model. This is a five stage process. The stages in this process are volume, velocity, variety, veracity, value.
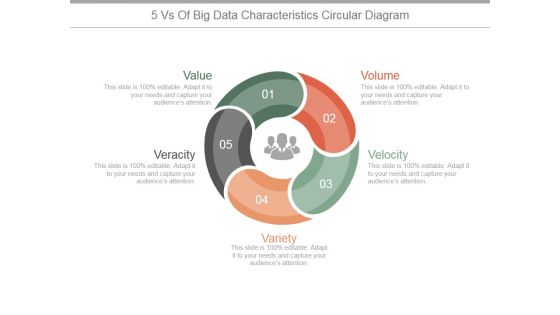
5 Vs Of Big Data Characteristics Circular Ppt PowerPoint Presentation Outline
This is a 5 vs of big data characteristics circular ppt powerpoint presentation outline. This is a five stage process. The stages in this process are value, volume, velocity, variety, veracity.
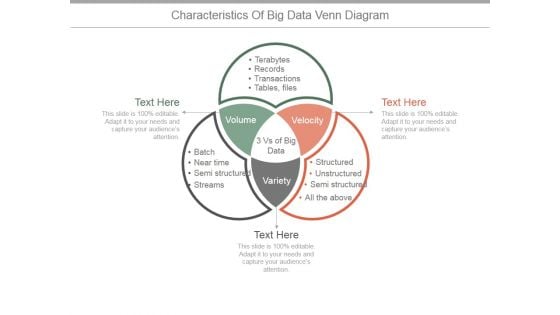
Characteristics Of Big Data Venn Diagram Ppt PowerPoint Presentation Example 2015
This is a characteristics of big data venn diagram ppt powerpoint presentation example 2015. This is a three stage process. The stages in this process are volume, velocity, variety, tables, files, transactions, records, terabytes.
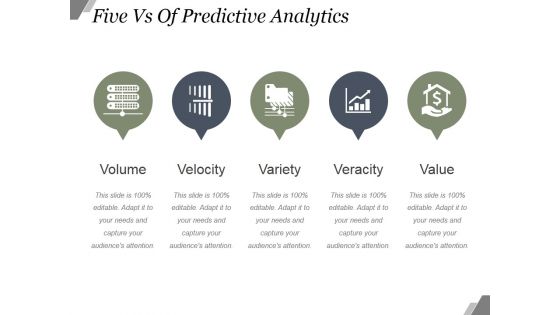
Five Vs Of Predictive Analytics Ppt PowerPoint Presentation Images
This is a five vs of predictive analytics ppt powerpoint presentation images. This is a five stage process. The stages in this process are volume, velocity, variety, veracity, value.
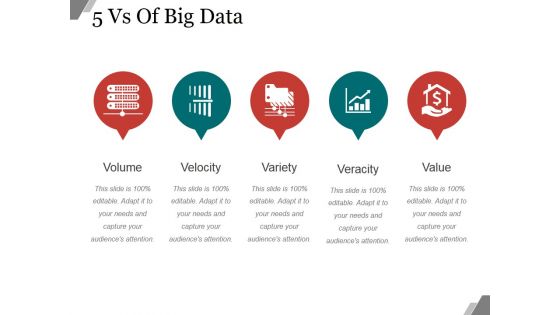
5 Vs Of Big Data Ppt PowerPoint Presentation Microsoft
This is a 5 vs of big data ppt powerpoint presentation microsoft. This is a five stage process. The stages in this process are volume, velocity, variety, veracity, value.
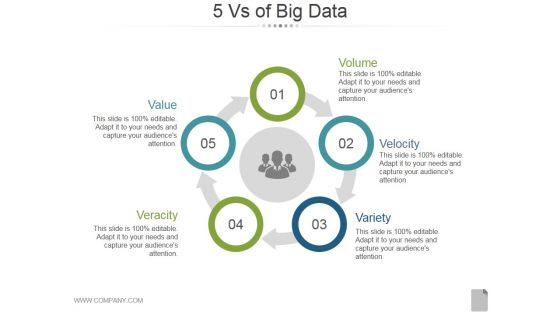
5 Vs Of Big Data Ppt PowerPoint Presentation Professional
This is a 5 vs of big data ppt powerpoint presentation professional. This is a five stage process. The stages in this process are volume, velocity, variety, veracity, value.
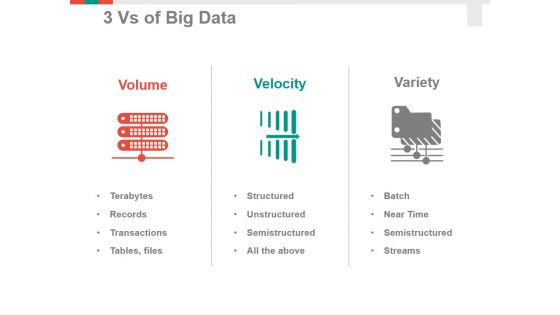
3 Vs Of Big Data Ppt PowerPoint Presentation Summary Example Introduction
This is a 3 vs of big data ppt powerpoint presentation summary example introduction. This is a three stage process. The stages in this process are volume, velocity, variety.
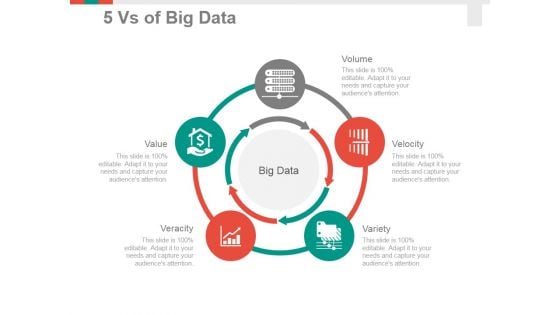
5 Vs Of Big Data Ppt PowerPoint Presentation Summary Visuals
This is a 5 vs of big data ppt powerpoint presentation summary visuals. This is a five stage process. The stages in this process are volume, velocity, variety, veracity, value.
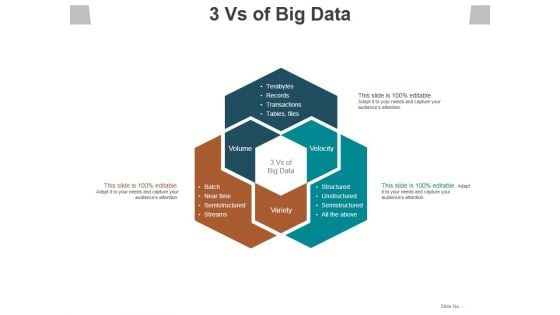
3 Vs Of Big Data Ppt PowerPoint Presentation Slides Samples
This is a 3 vs of big data ppt powerpoint presentation slides samples. This is a three stage process. The stages in this process are volume, variety, velocity, terabytes, transactions.

5 Vs Of Big Data Ppt PowerPoint Presentation Layouts Ideas
This is a 5 vs of big data ppt powerpoint presentation layouts ideas. This is a five stage process. The stages in this process are value, veracity, variety, velocity, volume.
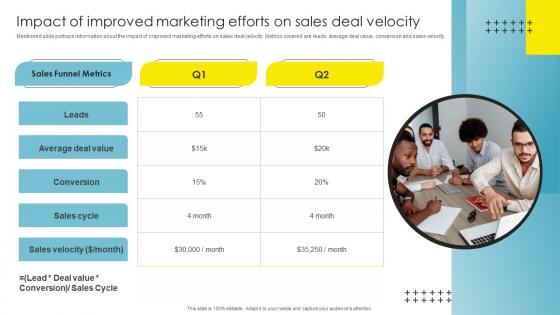
Strategic Brand Management Impact Of Improved Marketing Infographics Pdf
Mentioned slide portrays information about the impact of improved marketing efforts on sales deal velocity. Metrics covered are leads, average deal value, conversion and sales velocity. Here you can discover an assortment of the finest PowerPoint and Google Slides templates. With these templates, you can create presentations for a variety of purposes while simultaneously providing your audience with an eye catching visual experience. Download Strategic Brand Management Impact Of Improved Marketing Infographics Pdf to deliver an impeccable presentation. These templates will make your job of preparing presentations much quicker, yet still, maintain a high level of quality. Slidegeeks has experienced researchers who prepare these templates and write high quality content for you. Later on, you can personalize the content by editing the Strategic Brand Management Impact Of Improved Marketing Infographics Pdf. Mentioned slide portrays information about the impact of improved marketing efforts on sales deal velocity. Metrics covered are leads, average deal value, conversion and sales velocity.
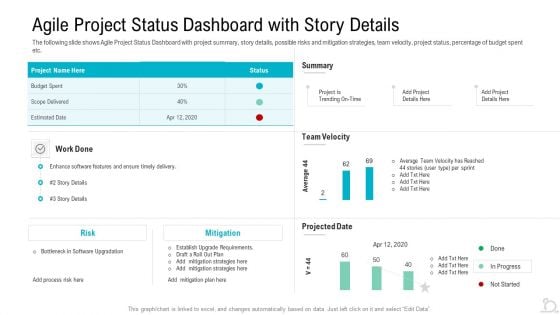
Agile Project Status Dashboard With Story Details Introduction PDF
The following slide shows Agile Project Status Dashboard with project summary, story details, possible risks and mitigation strategies, team velocity, project status, percentage of budget spent etc. Deliver and pitch your topic in the best possible manner with this agile project status dashboard with story details introduction pdf. Use them to share invaluable insights on team velocity, mitigation, risk and impress your audience. This template can be altered and modified as per your expectations. So, grab it now.
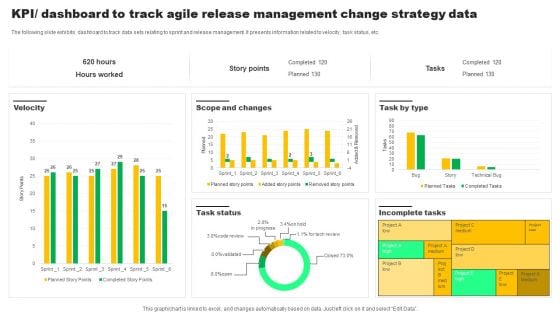
Kpi Dashboard To Track Agile Release Management Change Strategy Data Mockup PDF
The following slide exhibits dashboard to track data sets relating to sprint and release management. It presents information related to velocity, task status, etc. Showcasing this set of slides titled Kpi Dashboard To Track Agile Release Management Change Strategy Data Mockup PDF. The topics addressed in these templates are Velocity, Task Status, Incomplete Tasks. All the content presented in this PPT design is completely editable. Download it and make adjustments in color, background, font etc. as per your unique business setting.
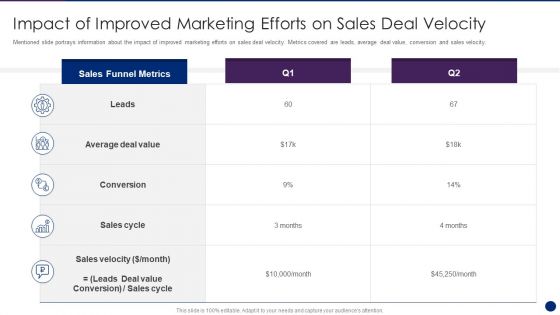
Interpreting Market Kinetics Influence Customer Purchasing Impact Of Improved Marketing Background PDF
Mentioned slide portrays information about the impact of improved marketing efforts on sales deal velocity. Metrics covered are leads, average deal value, conversion and sales velocity. Deliver an awe inspiring pitch with this creative interpreting market kinetics influence customer purchasing impact of improved marketing background pdf bundle. Topics like global tech market outlook purchases of tech goods and services can be discussed with this completely editable template. It is available for immediate download depending on the needs and requirements of the user.
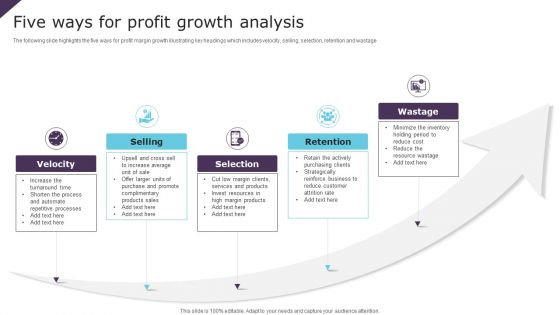
Five Ways For Profit Growth Analysis Ppt PowerPoint Presentation Gallery Background PDF
The following slide highlights the five ways for profit margin growth illustrating key headings which includes velocity, selling, selection, retention and wastage. Presenting Five Ways For Profit Growth Analysis Ppt PowerPoint Presentation Gallery Background PDF to dispense important information. This template comprises five stages. It also presents valuable insights into the topics including Velocity, Selling, Selection, Retention, Wastage. This is a completely customizable PowerPoint theme that can be put to use immediately. So, download it and address the topic impactfully.

 Home
Home