Year Comparison
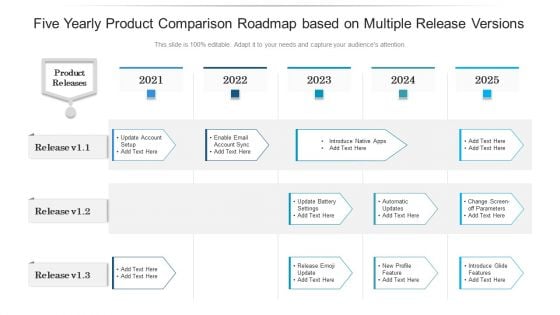
Five Yearly Product Comparison Roadmap Based On Multiple Release Versions Guidelines
Presenting our jaw dropping five yearly product comparison roadmap based on multiple release versions guidelines. You can alternate the color, font size, font type, and shapes of this PPT layout according to your strategic process. This PPT presentation is compatible with Google Slides and is available in both standard screen and widescreen aspect ratios. You can also download this well researched PowerPoint template design in different formats like PDF, JPG, and PNG. So utilize this visually appealing design by clicking the download button given below.
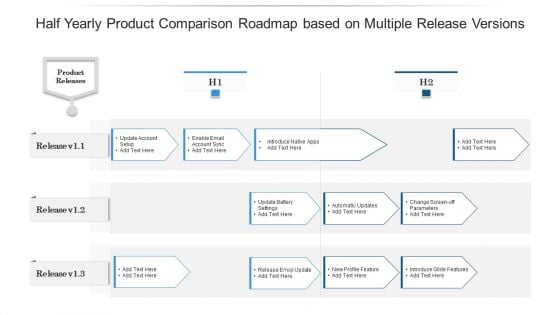
Half Yearly Product Comparison Roadmap Based On Multiple Release Versions Information
Presenting our jaw dropping half yearly product comparison roadmap based on multiple release versions information. You can alternate the color, font size, font type, and shapes of this PPT layout according to your strategic process. This PPT presentation is compatible with Google Slides and is available in both standard screen and widescreen aspect ratios. You can also download this well researched PowerPoint template design in different formats like PDF, JPG, and PNG. So utilize this visually appealing design by clicking the download button given below.
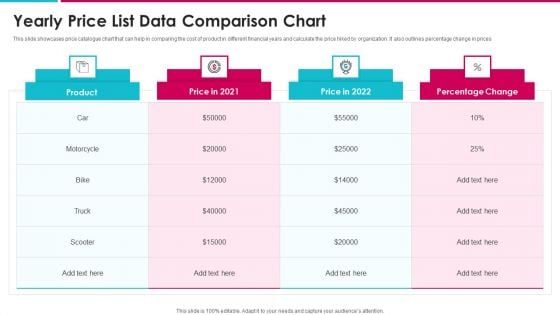
Yearly Price List Data Comparison Chart Structure PDF
This slide showcases price catalogue chart that can help in comparing the cost of product in different financial years and calculate the price hiked by organization. It also outlines percentage change in prices Showcasing this set of slides titled yearly price list data comparison chart structure pdf. The topics addressed in these templates are yearly price list data comparison chart. All the content presented in this PPT design is completely editable. Download it and make adjustments in color, background, font etc. as per your unique business setting.
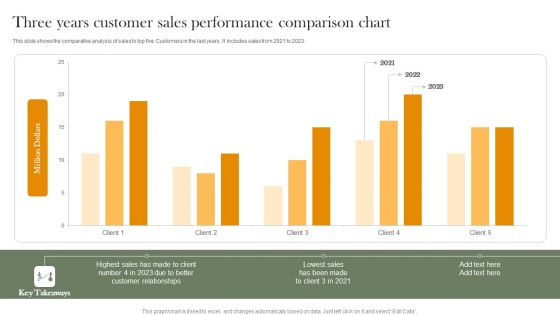
Three Years Customer Sales Performance Comparison Chart Professional PDF
This slide shows the comparative analysis of sales to top five Customers in the last years. It includes sales from 2021 to 2023. Pitch your topic with ease and precision using this Three Years Customer Sales Performance Comparison Chart Professional PDF. This layout presents information on Highest Sales, Customer Relationships, Lowest Sales. It is also available for immediate download and adjustment. So, changes can be made in the color, design, graphics or any other component to create a unique layout.
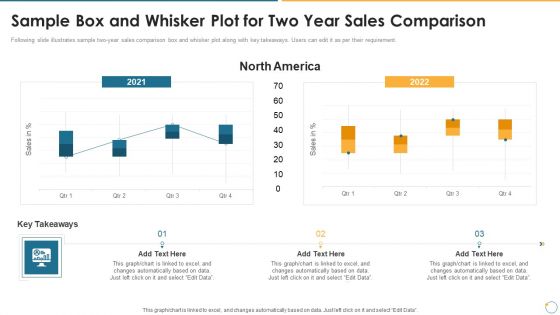
Collection Of Quality Assurance PPT Sample Box And Whisker Plot For Two Year Sales Comparison Elements PDF
Following slide illustrates sample two to year sales comparison box and whisker plot along with key takeaways. Users can edit it as per their requirement. Deliver an awe inspiring pitch with this creative collection of quality assurance ppt sample box and whisker plot for two year sales comparison elements pdf bundle. Topics like graph, data can be discussed with this completely editable template. It is available for immediate download depending on the needs and requirements of the user.
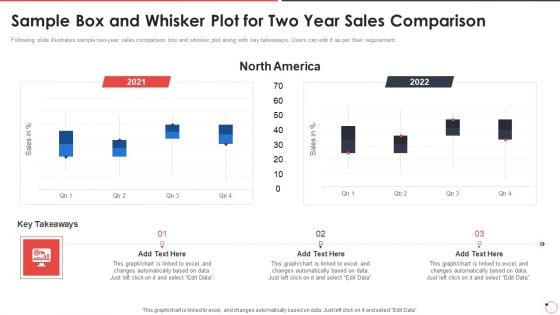
Quality Assurance Templates Set 1 Sample Box And Whisker Plot For Two Year Sales Comparison Ppt Slides Visual Aids PDF
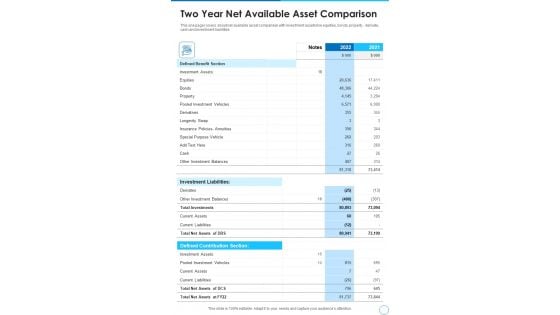
Two Year Net Available Asset Comparison Template 139 One Pager Documents
Presenting you a fantastic Two Year Net Available Asset Comparison Template 139 One Pager Documents. This piece is crafted on hours of research and professional design efforts to ensure you have the best resource. It is completely editable and its design allow you to rehash its elements to suit your needs. Get this Two Year Net Available Asset Comparison Template 139 One Pager Documents A4 One-pager now.
Three Years Products Sales Comparison Of Business Ppt PowerPoint Presentation Icon Layouts PDF
Presenting three years products sales comparison of business ppt powerpoint presentation icon layouts pdf to dispense important information. This template comprises three stages. It also presents valuable insights into the topics including three years products sales comparison of business. This is a completely customizable PowerPoint theme that can be put to use immediately. So, download it and address the topic impactfully.

Cost Of Goods And Revenue Comparison Yearly Comparative Analysis Slides PDF
This slide shows comparison of last three years revenue, sales, expenses, interest, research and development, tax etc. of an organization. Pitch your topic with ease and precision using this Cost Of Goods And Revenue Comparison Yearly Comparative Analysis Slides PDF. This layout presents information on Expenses, Research Development, Cost Goods. It is also available for immediate download and adjustment. So, changes can be made in the color, design, graphics or any other component to create a unique layout.
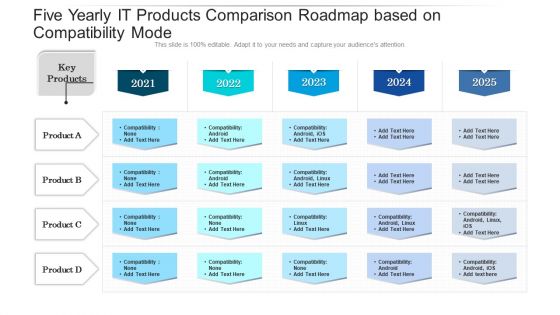
Five Yearly IT Products Comparison Roadmap Based On Compatibility Mode Graphics
Presenting our innovatively structured five yearly it products comparison roadmap based on compatibility mode graphics Template. Showcase your roadmap process in different formats like PDF, PNG, and JPG by clicking the download button below. This PPT design is available in both Standard Screen and Widescreen aspect ratios. It can also be easily personalized and presented with modified font size, font type, color, and shapes to measure your progress in a clear way.

Five Yearly Multiple Product Comparison Roadmap Based On Key Metrics Slides
Introducing our five yearly multiple product comparison roadmap based on key metrics slides. This PPT presentation is Google Slides compatible, therefore, you can share it easily with the collaborators for measuring the progress. Also, the presentation is available in both standard screen and widescreen aspect ratios. So edit the template design by modifying the font size, font type, color, and shapes as per your requirements. As this PPT design is fully editable it can be presented in PDF, JPG and PNG formats.
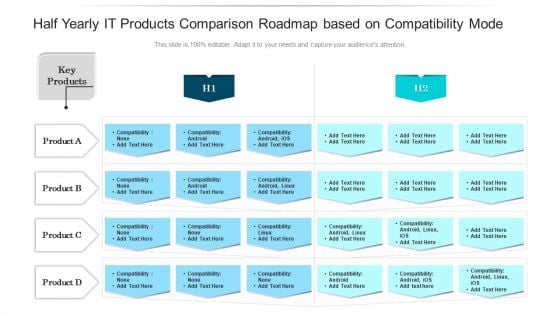
Half Yearly IT Products Comparison Roadmap Based On Compatibility Mode Structure
Presenting our innovatively structured half yearly it products comparison roadmap based on compatibility mode structure Template. Showcase your roadmap process in different formats like PDF, PNG, and JPG by clicking the download button below. This PPT design is available in both Standard Screen and Widescreen aspect ratios. It can also be easily personalized and presented with modified font size, font type, color, and shapes to measure your progress in a clear way.

Half Yearly Multiple Product Comparison Roadmap Based On Key Metrics Download
Introducing our half yearly multiple product comparison roadmap based on key metrics download. This PPT presentation is Google Slides compatible, therefore, you can share it easily with the collaborators for measuring the progress. Also, the presentation is available in both standard screen and widescreen aspect ratios. So edit the template design by modifying the font size, font type, color, and shapes as per your requirements. As this PPT design is fully editable it can be presented in PDF, JPG and PNG formats.
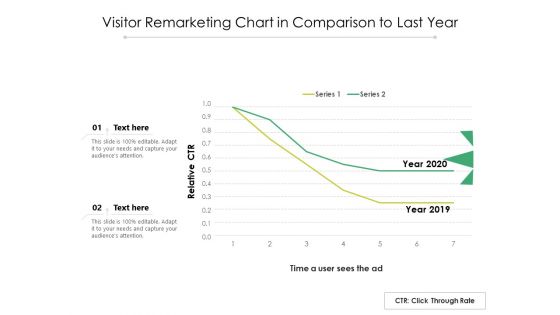
Visitor Remarketing Chart In Comparison To Last Year Ppt PowerPoint Presentation File Themes PDF
Showcasing this set of slides titled visitor remarketing chart in comparison to last year ppt powerpoint presentation file themes pdf. The topics addressed in these templates are visitor remarketing chart in comparison to last year. All the content presented in this PPT design is completely editable. Download it and make adjustments in color, background, font etc. as per your unique business setting.
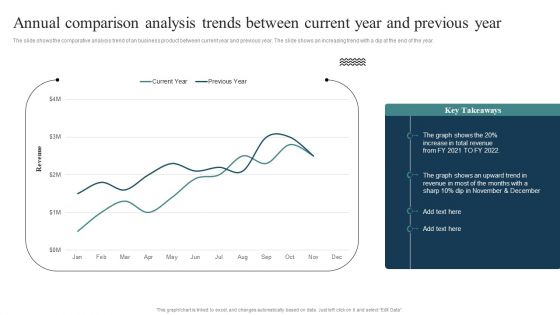
Annual Comparison Analysis Trends Between Current Year And Previous Year Rules PDF
The slide shows the comparative analysis trend of an business product between current year and previous year. The slide shows an increasing trend with a dip at the end of the year. Showcasing this set of slides titled Annual Comparison Analysis Trends Between Current Year And Previous Year Rules PDF. The topics addressed in these templates are Annual Comparison, Analysis Trends, Between Current . All the content presented in this PPT design is completely editable. Download it and make adjustments in color, background, font etc. as per your unique business setting.
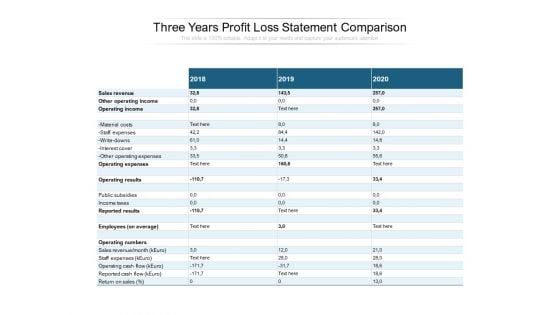
Three Years Profit Loss Statement Comparison Ppt PowerPoint Presentation Professional Design Templates
Presenting this set of slides with name three years profit loss statement comparison ppt powerpoint presentation professional design templates. The topics discussed in these slides are sales revenue, other operating income, operating expenses, operating results, employees. This is a completely editable PowerPoint presentation and is available for immediate download. Download now and impress your audience.
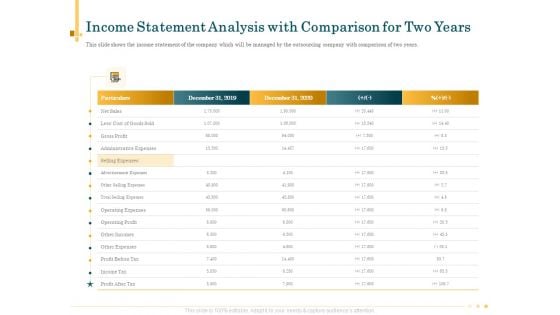
Outsource Bookkeeping Service Manage Financial Transactions Income Statement Analysis Comparison Two Years Mockup PDF
Presenting this set of slides with name outsource bookkeeping service manage financial transactions income statement analysis comparison two years mockup pdf. The topics discussed in these slides are cost, expenses, administrative, gross profit, operating profit. This is a completely editable PowerPoint presentation and is available for immediate download. Download now and impress your audience.

Loan Scorecard Individual Credit Rating Scorecard In Comparison With Previous Years Ppt Infographic Template Graphics PDF
Deliver and pitch your topic in the best possible manner with this loan scorecard individual credit rating scorecard in comparison with previous years ppt infographic template graphics pdf. Use them to share invaluable insights on individual credit rating scorecard in comparison with previous years and impress your audience. This template can be altered and modified as per your expectations. So, grab it now.
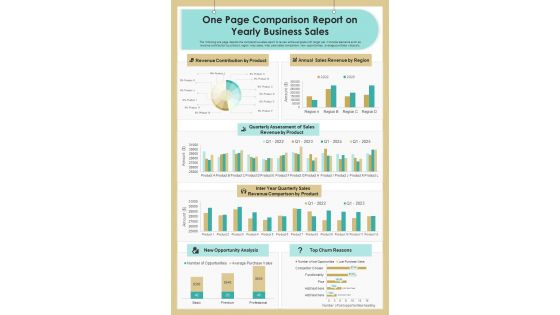
One Page Comparison Report On Yearly Business Sales PDF Document PPT Template
Presenting you an exemplary One Page Comparison Report On Yearly Business Sales PDF Document PPT Template. Our one-pager template comprises all the must-have essentials of an inclusive document. You can edit it with ease, as its layout is completely editable. With such freedom, you can tweak its design and other elements to your requirements. Download this One Page Comparison Report On Yearly Business Sales PDF Document PPT Template Download now.

Five Years Timeline For Product Performance Comparison Ppt PowerPoint Presentation Pictures Introduction PDF
This is a five years timeline for product performance comparison ppt powerpoint presentation pictures introduction pdf template with various stages. Focus and dispense information on six stages using this creative set, that comes with editable features. It contains large content boxes to add your information on topics like five years timeline for product performance comparison 2016 to 2020. You can also showcase facts, figures, and other relevant content using this PPT layout. Grab it now.
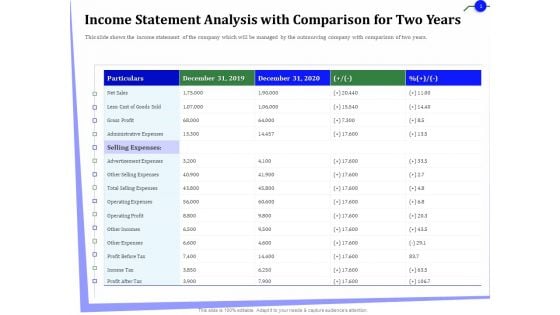
Outsourcing Finance Accounting Processes Income Statement Analysis With Comparison For Two Years Template PDF
Presenting this set of slides with name outsourcing finance accounting processes income statement analysis with comparison for two years template pdf. The topics discussed in these slides are cost, expenses, administrative, gross profit, operating profit. This is a completely editable PowerPoint presentation and is available for immediate download. Download now and impress your audience.
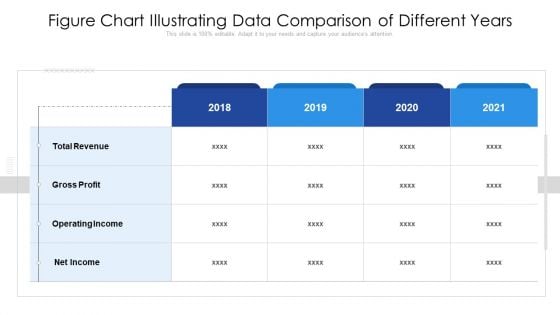
Figure Chart Illustrating Data Comparison Of Different Years Ppt PowerPoint Presentation File Inspiration PDF
Pitch your topic with ease and precision using this figure chart illustrating data comparison of different years ppt powerpoint presentation file inspiration pdf. This layout presents information on gross profit, total revenue, operating income. It is also available for immediate download and adjustment. So, changes can be made in the color, design, graphics or any other component to create a unique layout.
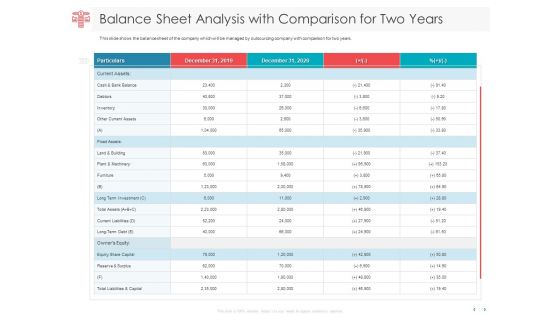
Managing CFO Services Balance Sheet Analysis With Comparison For Two Years Formats PDF
Presenting this set of slides with name managing cfo services balance sheet analysis with comparison for two years formats pdf. The topics discussed in these slides are current assets, fixed assets, owners equity, equity share capital. This is a completely editable PowerPoint presentation and is available for immediate download. Download now and impress your audience.
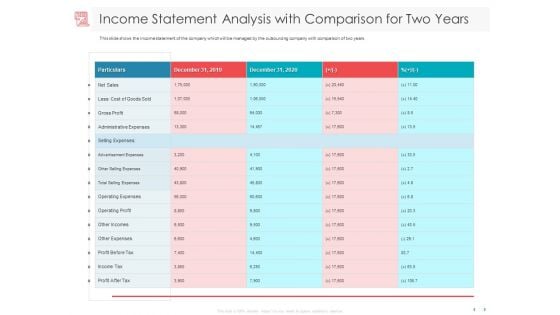
Managing CFO Services Income Statement Analysis With Comparison For Two Years Infographics PDF
Presenting this set of slides with name managing cfo services income statement analysis with comparison for two years infographics pdf. The topics discussed in these slides are net sales, gross profit, operating profit, income tax, operating expenses, administrative expenses, profit before tax. This is a completely editable PowerPoint presentation and is available for immediate download. Download now and impress your audience.
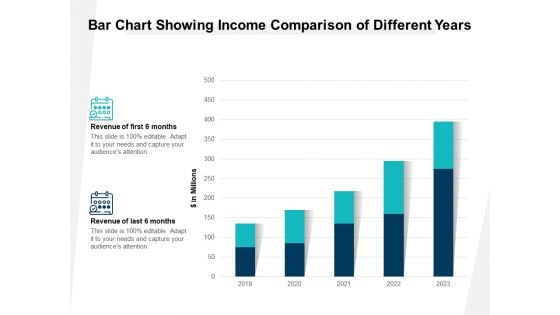
Bar Chart Showing Income Comparison Of Different Years Ppt PowerPoint Presentation Gallery Ideas PDF
Presenting this set of slides with name bar chart showing income comparison of different years ppt powerpoint presentation gallery ideas pdf. The topics discussed in these slides are revenue of first 6 months, revenue of last 6 months. This is a completely editable PowerPoint presentation and is available for immediate download. Download now and impress your audience.
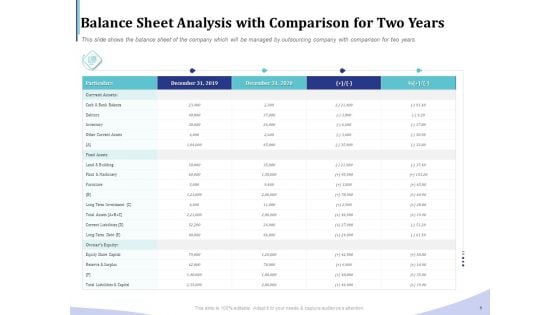
Accounting Bookkeeping Services Balance Sheet Analysis With Comparison For Two Years Mockup PDF
Presenting this set of slides with name accounting bookkeeping services balance sheet analysis with comparison for two years mockup pdf. The topics discussed in these slides are inventory, investment, equity, liabilities, current assets. This is a completely editable PowerPoint presentation and is available for immediate download. Download now and impress your audience.
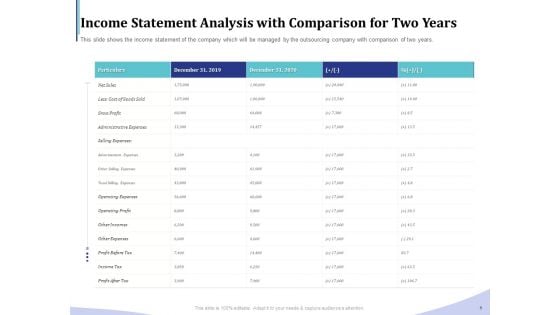
Accounting Bookkeeping Services Income Statement Analysis With Comparison For Two Years Rules PDF
Presenting this set of slides with name accounting bookkeeping services income statement analysis with comparison for two years rules pdf. The topics discussed in these slides are cost, expenses, administrative, gross profit, operating profit. This is a completely editable PowerPoint presentation and is available for immediate download. Download now and impress your audience.

BPO Managing Enterprise Financial Transactions Balance Sheet Analysis With Comparison For Two Years Rules PDF
Presenting this set of slides with name bpo managing enterprise financial transactions balance sheet analysis with comparison for two years rules pdf. The topics discussed in these slides are inventory, investment, equity, liabilities, current assets. This is a completely editable PowerPoint presentation and is available for immediate download. Download now and impress your audience.
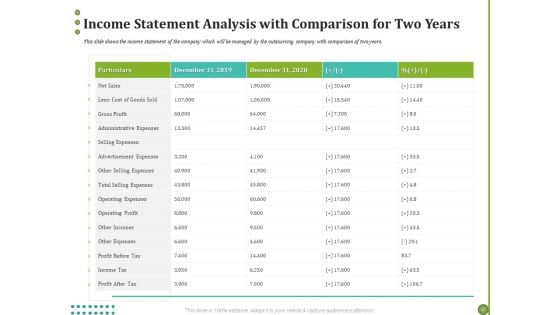
BPO Managing Enterprise Financial Transactions Income Statement Analysis With Comparison For Two Years Ideas PDF
Presenting this set of slides with name bpo managing enterprise financial transactions income statement analysis with comparison for two years ideas pdf. The topics discussed in these slides are cost, expenses, administrative, gross profit, operating profit. This is a completely editable PowerPoint presentation and is available for immediate download. Download now and impress your audience.
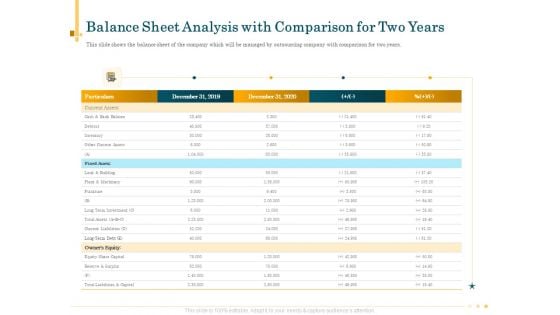
Outsource Bookkeeping Service Manage Financial Transactions Balance Sheet Analysis With Comparison For Two Years Rules PDF
Presenting this set of slides with name outsource bookkeeping service manage financial transactions balance sheet analysis with comparison for two years rules pdf. The topics discussed in these slides are inventory, investment, equity, liabilities, current assets. This is a completely editable PowerPoint presentation and is available for immediate download. Download now and impress your audience.
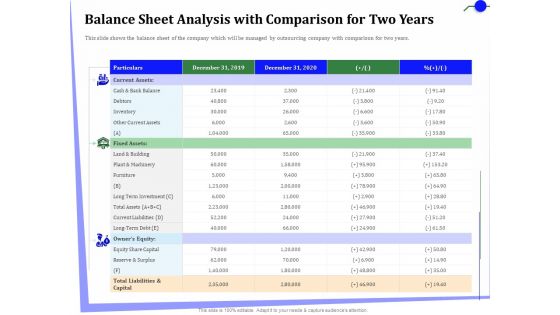
Outsourcing Finance Accounting Processes Balance Sheet Analysis With Comparison For Two Years Rules PDF
Presenting this set of slides with name outsourcing finance accounting processes balance sheet analysis with comparison for two years rules pdf. The topics discussed in these slides are inventory, investment, equity, liabilities, current assets. This is a completely editable PowerPoint presentation and is available for immediate download. Download now and impress your audience.
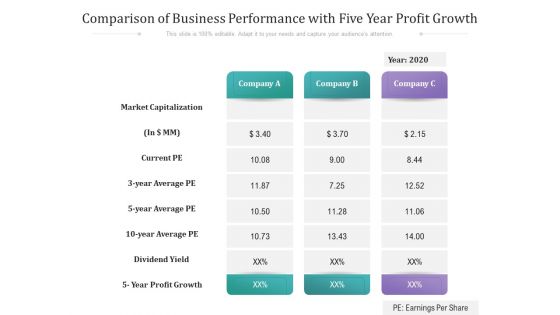
Comparison Of Business Performance With Five Year Profit Growth Ppt PowerPoint Presentation Layouts Summary PDF
Presenting this set of slides with name comparison of business performance with five year profit growth ppt powerpoint presentation layouts summary pdf. The topics discussed in these slides are market capitalization, current pe, dividend yield, 5 year profit growth, 2020. This is a completely editable PowerPoint presentation and is available for immediate download. Download now and impress your audience.
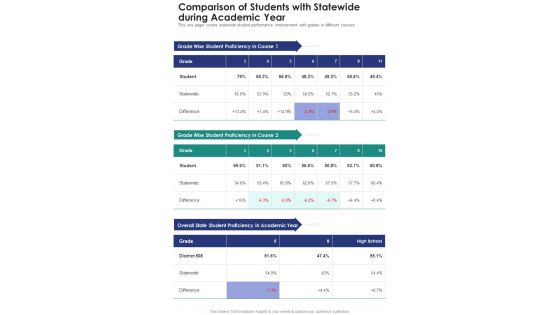
Comparison Of Students With Statewide During Academic Year One Pager Documents
This one pager covers statewide student performance improvement with grades in different courses. Presenting you an exemplary Comparison Of Students With Statewide During Academic Year One Pager Documents. Our one-pager comprises all the must-have essentials of an inclusive document. You can edit it with ease, as its layout is completely editable. With such freedom, you can tweak its design and other elements to your requirements. Download this Comparison Of Students With Statewide During Academic Year One Pager Documents brilliant piece now.
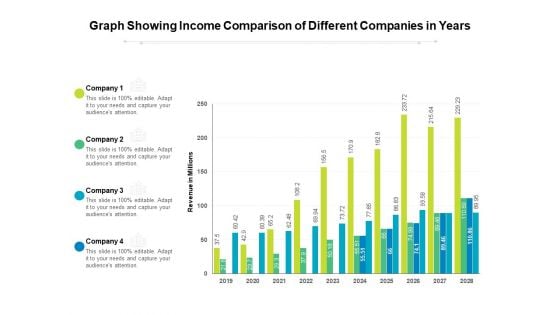
Graph Showing Income Comparison Of Different Companies In Years Ppt PowerPoint Presentation Gallery Clipart PDF
Presenting this set of slides with name graph showing income comparison of different companies in years ppt powerpoint presentation gallery clipart pdf. The topics discussed in these slide is graph showing income comparison of different companies in years. This is a completely editable PowerPoint presentation and is available for immediate download. Download now and impress your audience.
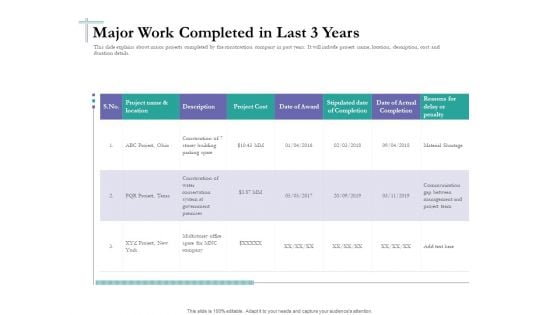
Bidding Cost Comparison Major Work Completed In Last 3 Years Ppt Inspiration Influencers PDF
This slide explains about major projects completed by the construction company in past years. It will include project name, location, description, cost and duration details. Deliver and pitch your topic in the best possible manner with this Bidding Cost Comparison Major Work Completed In Last 3 Years Ppt Inspiration Influencers PDF. Use them to share invaluable insights on project name and location, description, project cost, date of award, stipulated date of completion and impress your audience. This template can be altered and modified as per your expectations. So, grab it now.
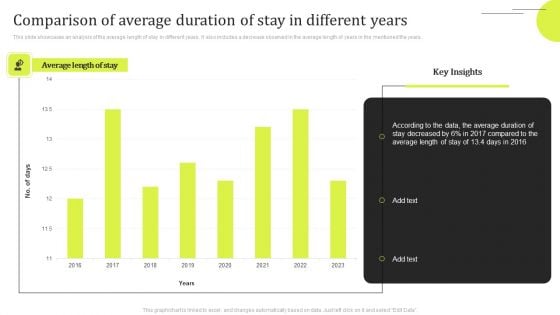
Comparison Of Average Duration Of Stay In Different Years Summary PDF
This slide showcases an analysis of the average length of stay in different years. It also includes a decrease observed in the average length of years in the mentioned the years. Showcasing this set of slides titled Comparison Of Average Duration Of Stay In Different Years Summary PDF. The topics addressed in these templates are Key Insights, Average Duration. All the content presented in this PPT design is completely editable. Download it and make adjustments in color, background, font etc. as per your unique business setting.
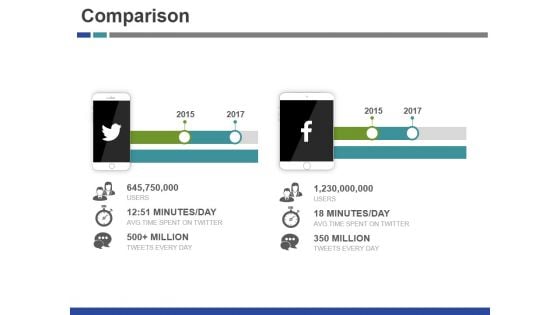
Comparison Ppt PowerPoint Presentation Styles Graphics Example
This is a comparison ppt powerpoint presentation styles graphics example. This is a two stage process. The stages in this process are year, comparison, technology, mobile, million.
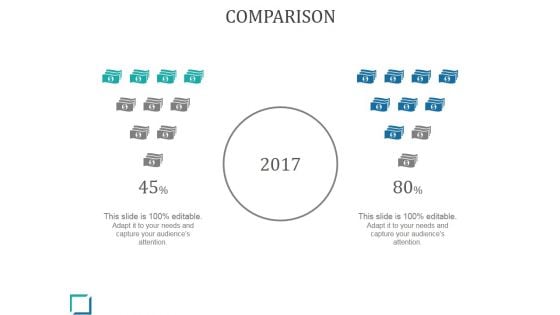
Comparison Ppt PowerPoint Presentation Guide
This is a comparison ppt powerpoint presentation guide. This is a two stage process. The stages in this process are business, marketing, year, finance, percentage.
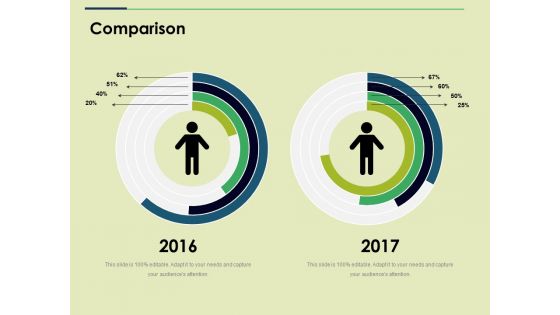
Comparison Ppt PowerPoint Presentation File Graphics Template
This is a comparison ppt powerpoint presentation file graphics template. This is a two stage process. The stages in this process are comparison, years, business, marketing, strategy, percentage.
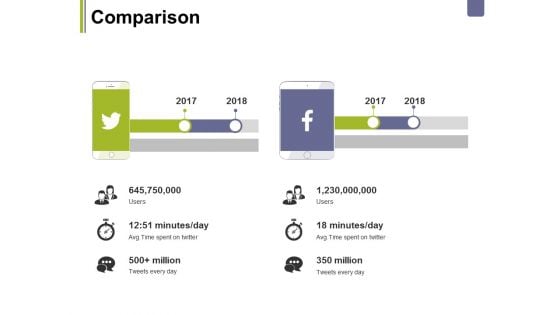
Comparison Ppt PowerPoint Presentation Infographics Templates
This is a comparison ppt powerpoint presentation infographics templates. This is a two stage process. The stages in this process are business, comparison, years, marketing, planning.
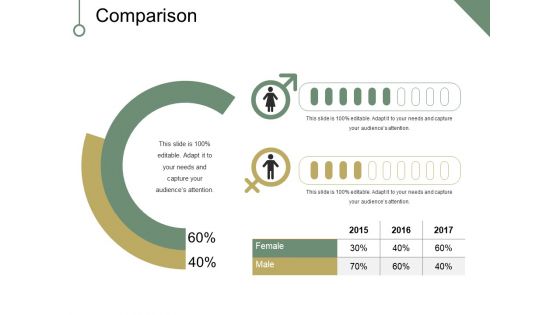
Comparison Ppt PowerPoint Presentation File Visual Aids
This is a comparison ppt powerpoint presentation file visual aids. This is a two stage process. The stages in this process are comparison, years, percentage, business, marketing.
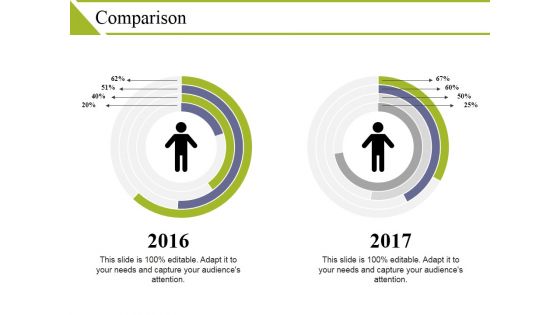
Comparison Ppt PowerPoint Presentation Pictures Objects
This is a comparison ppt powerpoint presentation pictures objects. This is a two stage process. The stages in this process are comparison, percentage, year, business, marketing.
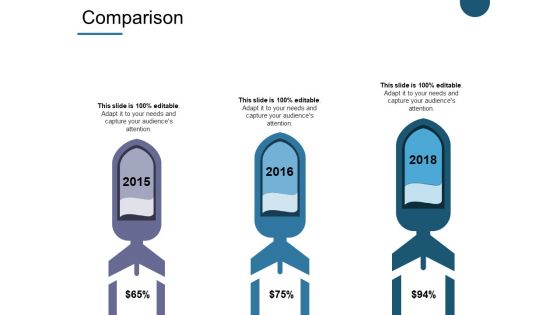
Comparison Ppt PowerPoint Presentation Outline Display
This is a comparison ppt powerpoint presentation outline display. This is a three stage process. The stages in this process are business, marketing, comparison, percentage, years.
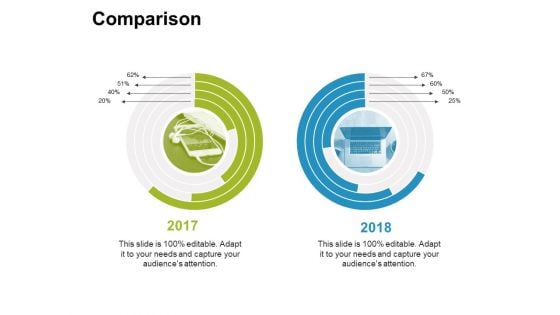
Comparison Ppt PowerPoint Presentation Gallery Slides
This is a comparison ppt powerpoint presentation gallery slides. This is a two stage process. The stages in this process are comparison, percentage, year, business.
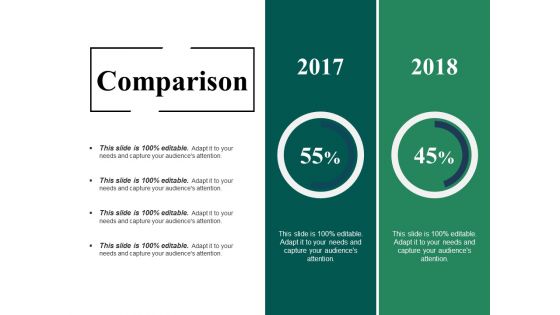
Comparison Ppt PowerPoint Presentation Gallery Topics
This is a comparison ppt powerpoint presentation gallery topics. This is a two stage process. The stages in this process are comparison, finance, year, business, marketing.
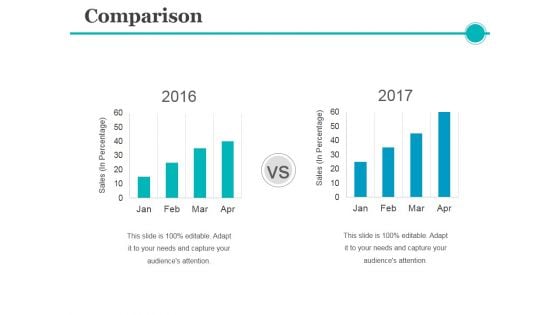
Comparison Ppt PowerPoint Presentation Layouts Example
This is a comparison ppt powerpoint presentation layouts example. This is a two stage process. The stages in this process are sales, year, success, growth, business.
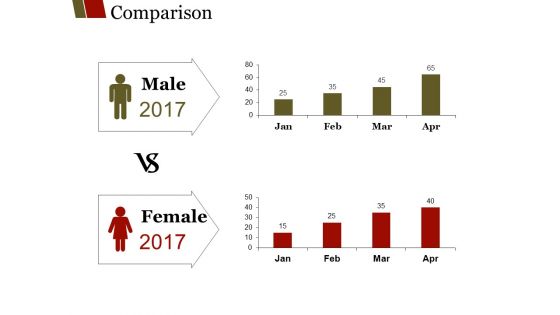
Comparison Ppt PowerPoint Presentation Outline Guidelines
This is a comparison ppt powerpoint presentation outline guidelines. This is a two stage process. The stages in this process are male, years, business, female, marketing.
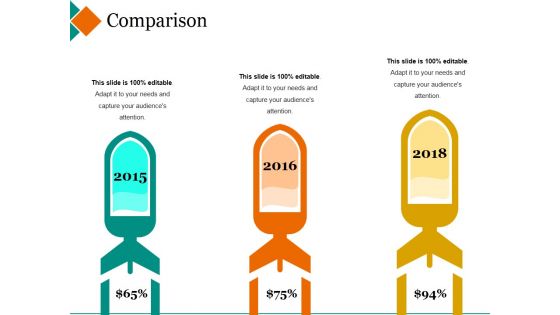
Comparison Ppt PowerPoint Presentation Layouts Gridlines
This is a comparison ppt powerpoint presentation layouts gridlines. This is a three stage process. The stages in this process are year, growth, success, percentage, finance.
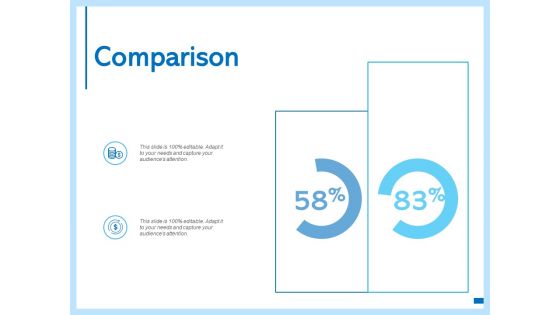
Comparison Management Ppt PowerPoint Presentation Ideas Microsoft
Presenting this set of slides with name comparison management ppt powerpoint presentation ideas microsoft. This is a two stage process. The stages in this process are year, investment balance at start of year, total amount, capital recovery, investment balance at end of year. This is a completely editable PowerPoint presentation and is available for immediate download. Download now and impress your audience.
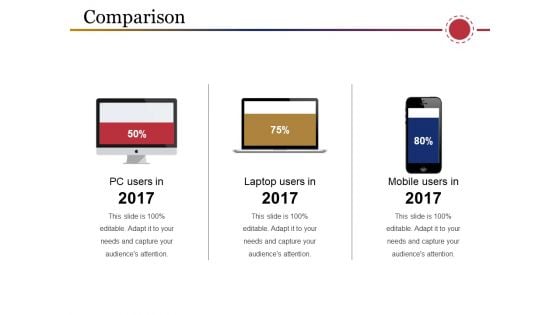
Comparison Ppt PowerPoint Presentation File Outline
This is a comparison ppt powerpoint presentation file outline. This is a three stage process. The stages in this process are pc users in, laptop users in, mobile users in, years, percentage.
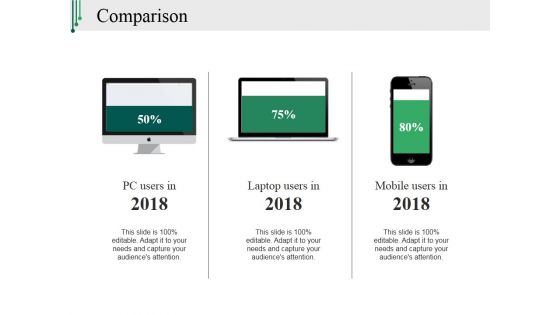
Comparison Ppt PowerPoint Presentation Slides Structure
This is a comparison ppt powerpoint presentation slides structure. This is a three stage process. The stages in this process are pc users in, laptop users in, mobile users in, technology, years.
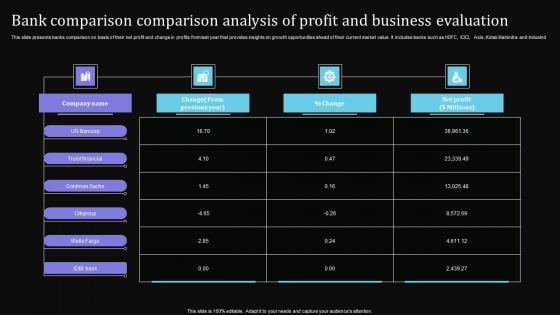
Bank Comparison Comparison Analysis Of Profit And Business Evaluation Designs PDF
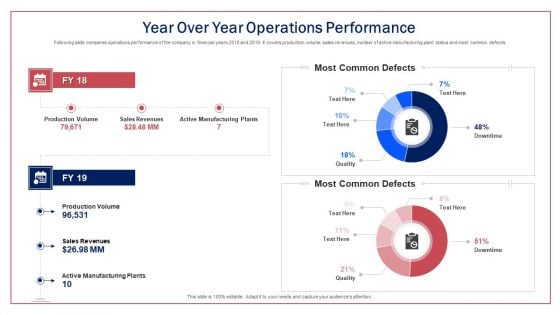
Year Over Year Operations Performance Ppt Infographic Template Shapes PDF
Following slide compares operations performance of the company in financial years 2018 and 2019. It covers production volume, sales revenues, number of active manufacturing plant status and most common defects.Deliver and pitch your topic in the best possible manner with this year over year operations performance ppt infographic template shapes pdf. Use them to share invaluable insights on most common defects, most common defects, active manufacturing plants, production volume and impress your audience. This template can be altered and modified as per your expectations. So, grab it now.
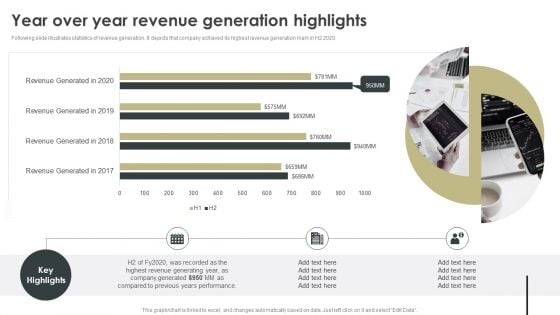
Year Over Year Revenue Generation Highlights Inspiration PDF
Following slide illustrates statistics of revenue generation. It depicts that company achieved its highest revenue generation mark in H2 2020. This Year Over Year Revenue Generation Highlights Inspiration PDF from Slidegeeks makes it easy to present information on your topic with precision. It provides customization options, so you can make changes to the colors, design, graphics, or any other component to create a unique layout. It is also available for immediate download, so you can begin using it right away. Slidegeeks has done good research to ensure that you have everything you need to make your presentation stand out. Make a name out there for a brilliant performance.
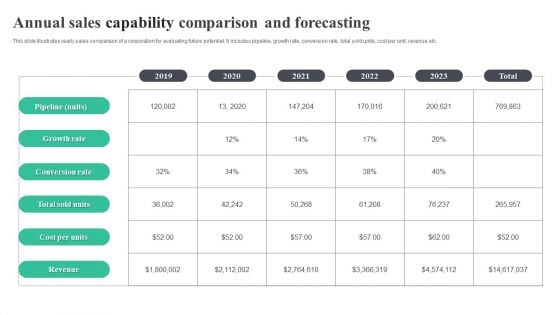
Annual Sales Capability Comparison And Forecasting Guidelines PDF
This slide illustrates yearly sales comparison of a corporation for evaluating future potential. It includes pipeline, growth rate, conversion rate, total sold units, cost per unit, revenue etc. Showcasing this set of slides titled Annual Sales Capability Comparison And Forecasting Guidelines PDF. The topics addressed in these templates are Annual Sales Capability, Comparison And Forecasting. All the content presented in this PPT design is completely editable. Download it and make adjustments in color, background, font etc. as per your unique business setting.
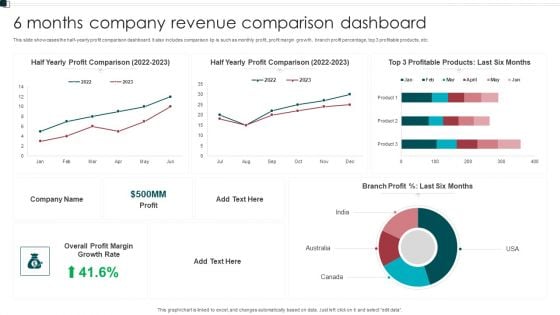
6 Months Company Revenue Comparison Dashboard Graphics PDF
This slide showcases the half yearly profit comparison dashboard. It also includes comparison kp is such as monthly profit, profit margin growth, branch profit percentage, top 3 profitable products, etc. Showcasing this set of slides titled 6 Months Company Revenue Comparison Dashboard Graphics PDF. The topics addressed in these templates are Growth Rate, Overall Profit Margin, Branch Profit. All the content presented in this PPT design is completely editable. Download it and make adjustments in color, background, font etc. as per your unique business setting.
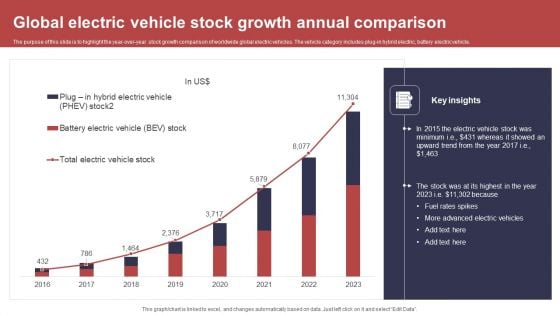
Global Electric Vehicle Stock Growth Annual Comparison Ideas PDF
The purpose of this slide is to highlight the year over year stock growth comparison of worldwide global electric vehicles. The vehicle category includes plug in hybrid electric, battery electric vehicle. Showcasing this set of slides titled Global Electric Vehicle Stock Growth Annual Comparison Ideas PDF. The topics addressed in these templates are Electric Vehicles, Stock Minimum, Highest. All the content presented in this PPT design is completely editable. Download it and make adjustments in color, background, font etc. as per your unique business setting.
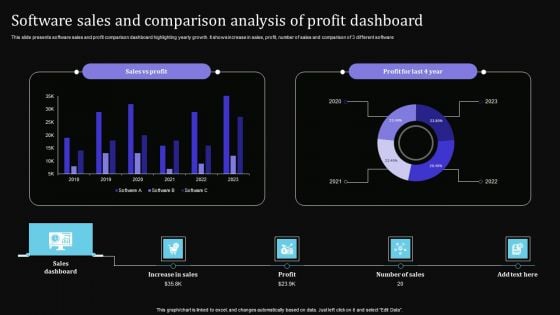
Software Sales And Comparison Analysis Of Profit Dashboard Sample PDF
This slide presents software sales and profit comparison dashboard highlighting yearly growth. It shows increase in sales, profit, number of sales and comparison of 3 different software. Showcasing this set of slides titled Software Sales And Comparison Analysis Of Profit Dashboard Sample PDF. The topics addressed in these templates are Increase Sales, Profit, Sales Dashboard. All the content presented in this PPT design is completely editable. Download it and make adjustments in color, background, font etc. as per your unique business setting.
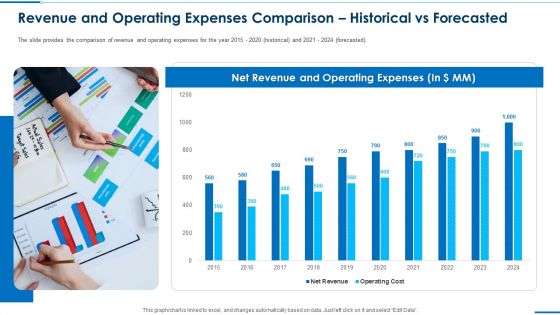
Revenue And Operating Expenses Comparison Historical Vs Forecasted Background PDF
The slide provides the comparison of revenue and operating expenses for the year 2015 2020 historical and 2021 2024 forecasted. Deliver an awe-inspiring pitch with this creative revenue and operating expenses comparison historical vs forecasted background pdf. bundle. Topics like revenue and operating expenses comparison historical vs forecasted can be discussed with this completely editable template. It is available for immediate download depending on the needs and requirements of the user.
Revenue And Operating Expenses Comparison Historical Vs Forecasted Pictures PDF
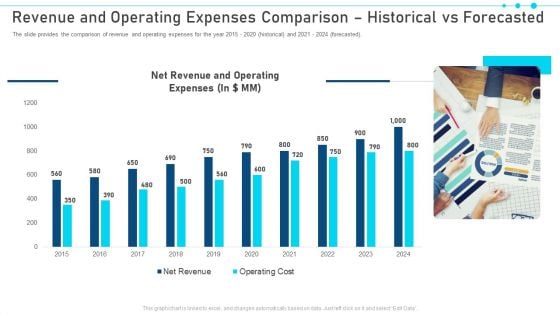
The slide provides the comparison of revenue and operating expenses for the year 2015 2020 historical and 2021 2024 forecasted. Deliver an awe-inspiring pitch with this creative revenue and operating expenses comparison historical vs forecasted pictures pdf. bundle. Topics like revenue and operating expenses comparison historical vs forecasted can be discussed with this completely editable template. It is available for immediate download depending on the needs and requirements of the user.

 Home
Home