Ytd Performance
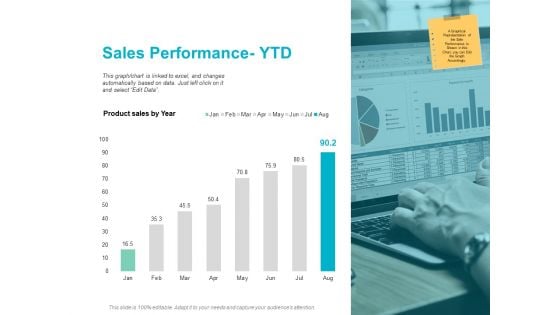
Sales Performance Ytd Planning Ppt PowerPoint Presentation Show Background Designs
This is a sales performance ytd planning ppt powerpoint presentation show background designs. The topics discussed in this diagram are marketing, business, management, planning, strategy This is a completely editable PowerPoint presentation, and is available for immediate download.
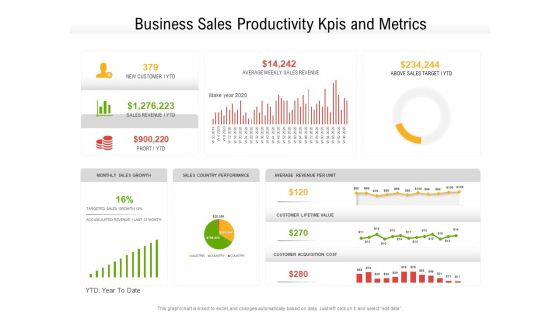
Business Sales Productivity Kpis And Metrics Ppt PowerPoint Presentation Professional Microsoft PDF
Presenting this set of slides with name business sales productivity kpis and metrics ppt powerpoint presentation professional microsoft pdf. The topics discussed in these slides are new customer i ytd, average weekly sales revenue, above sales target i ytd, profit i ytd, monthly sales growth, sales country performance. This is a completely editable PowerPoint presentation and is available for immediate download. Download now and impress your audience.
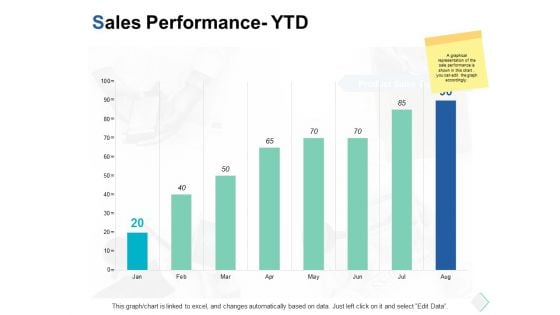
sales performance ytd investment ppt powerpoint presentation portfolio templates
Presenting this set of slides with name sales performance ytd investment ppt powerpoint presentation portfolio templates. The topics discussed in these slides are finance, marketing, management, investment, analysis. This is a completely editable PowerPoint presentation and is available for immediate download. Download now and impress your audience.
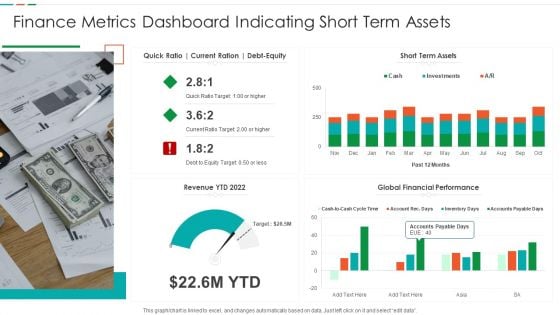
Finance Metrics Dashboard Indicating Short Term Assets Download PDF
This graph or chart is linked to excel, and changes automatically based on data. Just left click on it and select edit data. Pitch your topic with ease and precision using this Finance Metrics Dashboard Indicating Short Term Assets Download PDF. This layout presents information on Short Term Assets, Global Financial Performance, Revenue YTD 2022. It is also available for immediate download and adjustment. So, changes can be made in the color, design, graphics or any other component to create a unique layout.
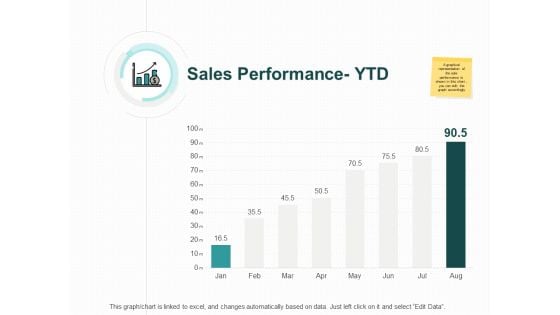
Sales Performance Ytd Percentage Ppt PowerPoint Presentation Slides Master Slide
Presenting this set of slides with name sales performance ytd percentage ppt powerpoint presentation slides master slide. The topics discussed in these slides are marketing, business, management, planning, strategy. This is a completely editable PowerPoint presentation and is available for immediate download. Download now and impress your audience.
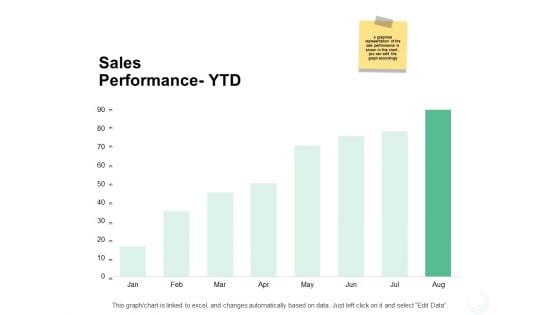
Sales Performance Ytd Finance Ppt PowerPoint Presentation Portfolio Pictures
Presenting this set of slides with name sales performance ytd finance ppt powerpoint presentation portfolio pictures. The topics discussed in these slides are finance, marketing, management, investment, analysis. This is a completely editable PowerPoint presentation and is available for immediate download. Download now and impress your audience.
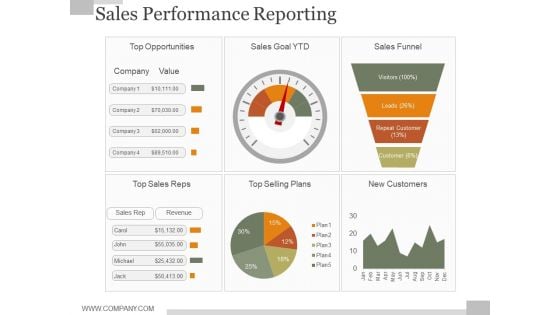
Sales Performance Reporting Ppt PowerPoint Presentation Styles
This is a sales performance reporting ppt powerpoint presentation styles. This is a four stage process. The stages in this process are top opportunities, sales goal ytd, sales funnel, top sales reps, top selling plans, new customers.
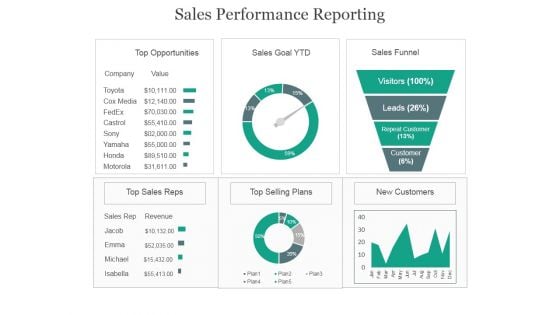
Sales Performance Reporting Ppt PowerPoint Presentation Model
This is a sales performance reporting ppt powerpoint presentation model. This is a six stage process. The stages in this process are top opportunities, sales goal ytd, sales funnel, top sales reps, top selling plans, new customers.
Sales Performance Tracking Ppt PowerPoint Presentation Deck
This is a sales performance tracking ppt powerpoint presentation deck. This is a four stage process. The stages in this process are top opportunities, sales goal ytd, sales funnel, company, value, company.
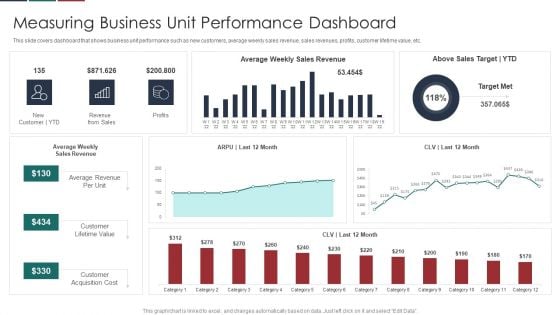
Deliver Efficiency Innovation Measuring Business Unit Performance Dashboard Background PDF
This slide covers dashboard that shows business unit performance such as new customers, average weekly sales revenue, sales revenues, profits, customer lifetime value, etc. Deliver an awe inspiring pitch with this creative Deliver Efficiency Innovation Measuring Business Unit Performance Dashboard Background PDF bundle. Topics like Customer Lifetime Value, Customer Acquisition Cost, Average Revenue Per Unit, Above Sales Target YTD can be discussed with this completely editable template. It is available for immediate download depending on the needs and requirements of the user.
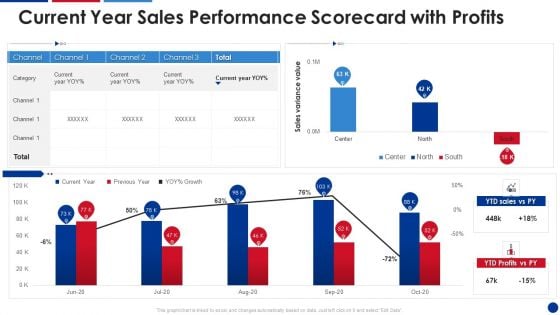
Current Year Sales Performance Scorecard With Profits Structure PDF
This graph or chart is linked to excel, and changes automatically based on data. Just left click on it and select Edit Data. Deliver and pitch your topic in the best possible manner with this Current Year Sales Performance Scorecard With Profits Structure PDF. Use them to share invaluable insights on Current Year, YTD Sales, Previous Year and impress your audience. This template can be altered and modified as per your expectations. So, grab it now.
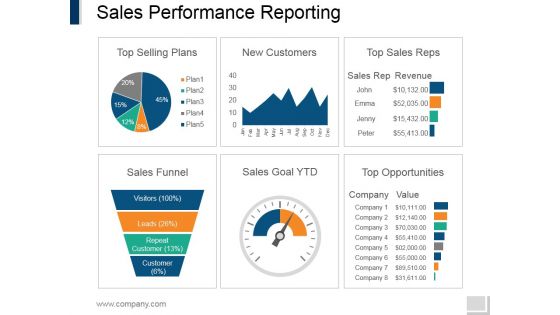
Sales Performance Reporting Ppt PowerPoint Presentation Model Summary
This is a sales performance reporting ppt powerpoint presentation model summary. This is a six stage process. The stages in this process are top selling plans, new customers, top sales reps, sales funnel, sales goal ytd, top opportunities.
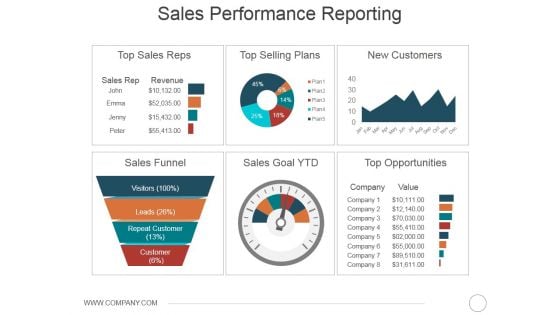
Sales Performance Reporting Ppt PowerPoint Presentation Layouts Inspiration
This is a sales performance reporting ppt powerpoint presentation layouts inspiration. This is a six stage process. The stages in this process are top sales reps, top selling plans, new customers, sales funnel, sales goal ytd, top opportunities.
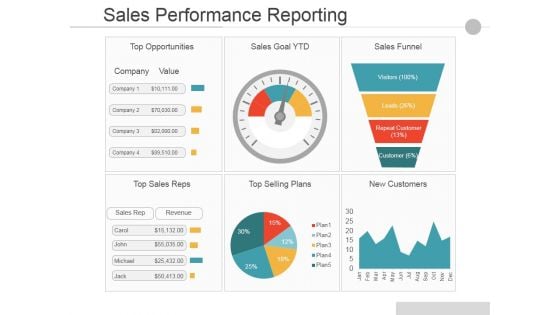
Sales Performance Reporting Ppt PowerPoint Presentation Infographics Portrait
This is a Sales Performance Reporting Ppt PowerPoint Presentation Infographics Portrait. This is a six stage process. The stages in this process are Top Opportunities, Sales Goal Ytd, Sales Funnel, Top Sales Reps, Top Selling Plans, New Customers.
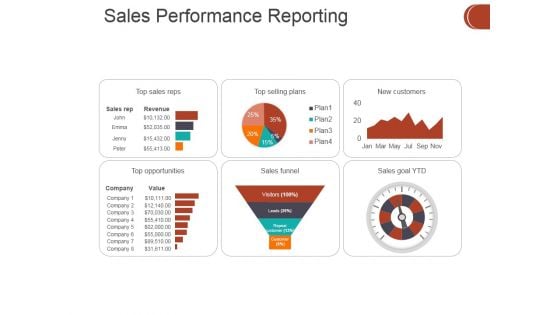
Sales Performance Reporting Ppt PowerPoint Presentation Styles Files
This is a sales performance reporting ppt powerpoint presentation styles files. This is a six stage process. The stages in this process are top sales reps, top selling plans, new customers, sales funnel, top opportunities, sales goal ytd.
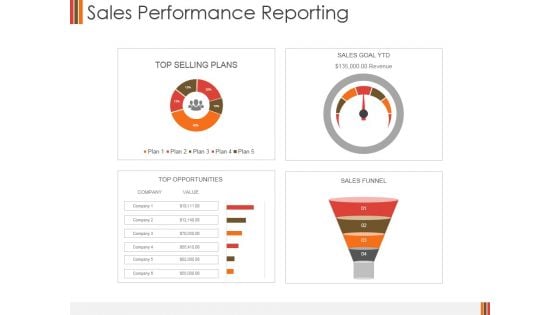
Sales Performance Reporting Ppt PowerPoint Presentation Slides Background Designs
This is a sales performance reporting ppt powerpoint presentation slides background designs. This is a four stage process. The stages in this process are top selling plans, sales goal ytd, top opportunities, sales funnel.
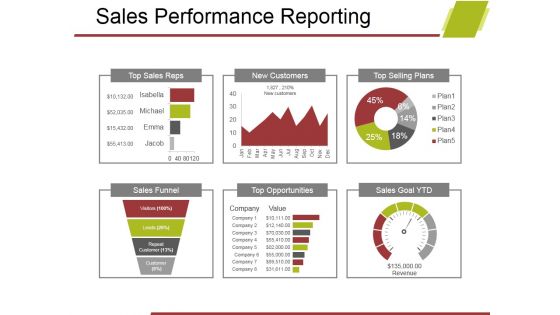
Sales Performance Reporting Ppt PowerPoint Presentation Gallery Introduction
This is a sales performance reporting ppt powerpoint presentation gallery introduction. This is a six stage process. The stages in this process are top sales reps, new customers, top selling plans, sales funnel, opportunities, sales goal ytd.
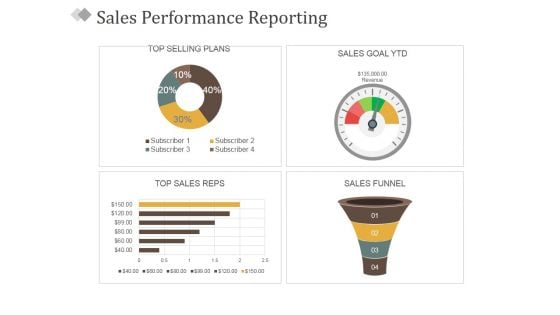
Sales Performance Reporting Ppt PowerPoint Presentation Ideas Aids
This is a sales performance reporting ppt powerpoint presentation ideas aids. This is a four stage process. The stages in this process are top selling plans, sales goal ytd, top sales reps, sales funnel.
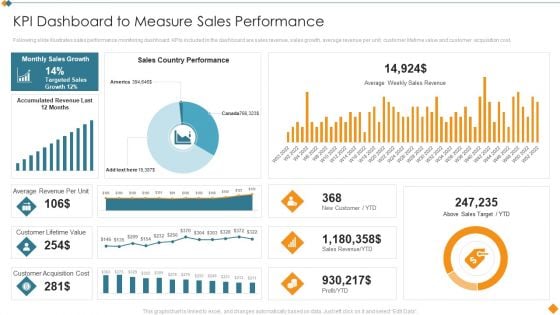
Maintaining Partner Relationships KPI Dashboard To Measure Sales Performance Rules PDF
Following slide illustrates sales performance monitoring dashboard. KPIs included in the dashboard are sales revenue, sales growth, average revenue per unit, customer lifetime value and customer acquisition cost. Deliver and pitch your topic in the best possible manner with this Maintaining Partner Relationships KPI Dashboard To Measure Sales Performance Rules PDF. Use them to share invaluable insights on Sales Country Performance, Above Sales Target, YTD, Customer Lifetime Value, Customer Acquisition Cost and impress your audience. This template can be altered and modified as per your expectations. So, grab it now.
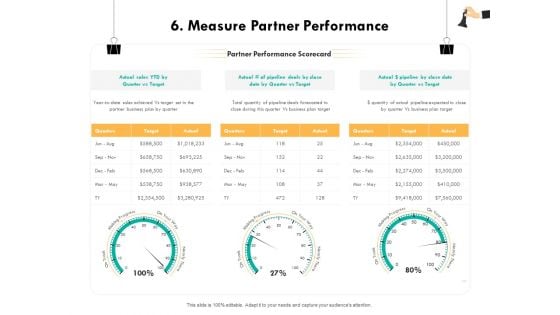
Strategic Sourcing For Better Procurement Value 6 Measure Partner Performance Ppt Graphics PDF
Presenting this set of slides with name strategic sourcing for better procurement value 6 measure partner performance ppt graphics pdf. The topics discussed in these slides are actual sales ytd by quarter vs target, actual pipeline deals close date quarter vs target, actual pipeline close date quarter vs target. This is a completely editable PowerPoint presentation and is available for immediate download. Download now and impress your audience.
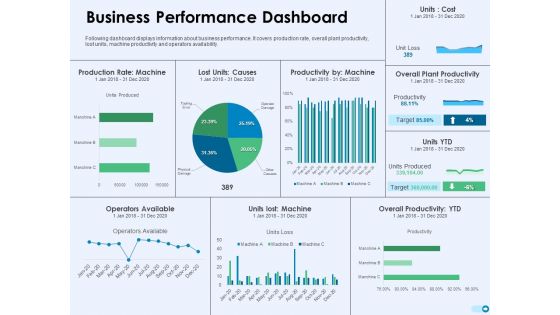
Tools For Prioritization Business Performance Dashboard Ppt PowerPoint Presentation Portfolio Clipart PDF
Following dashboard displays information about business performance. It covers production rate, overall plant productivity, lost units, machine productivity and operators availability. Deliver an awe-inspiring pitch with this creative tools for prioritization business performance dashboard ppt powerpoint presentation portfolio clipart pdf bundle. Topics like production rate machine, lost units causes, productivity by machine, overall plant productivity, units lost machine, overall productivity ytd, operators available can be discussed with this completely editable template. It is available for immediate download depending on the needs and requirements of the user.
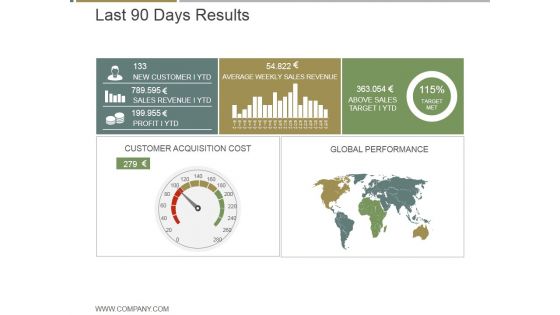
Last 90 Days Results Ppt PowerPoint Presentation Graphics
This is a last 90 days results ppt powerpoint presentation graphics. This is a five stage process. The stages in this process are new customer ytd, average weekly sales revenue, above sales target i ytd, customer acquisition cost, global performance.
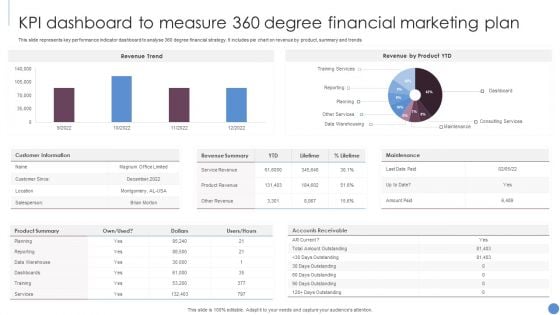
KPI Dashboard To Measure 360 Degree Financial Marketing Plan Slides PDF
This slide represents key performance indicator dashboard to analyse 360 degree financial strategy. It includes pie chart on revenue by product, summary and trends. Showcasing this set of slides titled KPI Dashboard To Measure 360 Degree Financial Marketing Plan Slides PDF. The topics addressed in these templates are Revenue Trend, Revenue Product YTD, Customer Information. All the content presented in this PPT design is completely editable. Download it and make adjustments in color, background, font etc. as per your unique business setting.
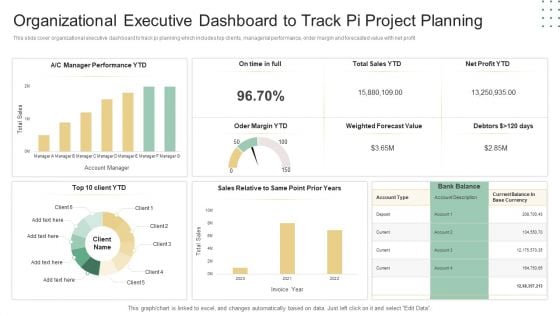
Organizational Executive Dashboard To Track Pi Project Planning Ppt Professional Background PDF
This slide cover organizational executive dashboard to track pi planning which includes top clients, managerial performance, order margin and forecasted value with net profit. Pitch your topic with ease and precision using this Organizational Executive Dashboard To Track Pi Project Planning Ppt Professional Background PDF. This layout presents information on Weighted Forecast Value, Top 10, Client YTD. It is also available for immediate download and adjustment. So, changes can be made in the color, design, graphics or any other component to create a unique layout.

 Home
Home